
Researchers at NOAA seek new techniques to advance hurricane forecasts to better protect life and property. In preparation for the upcoming 2023 hurricane season, which begins June 1, scientists are accelerating the use of small uncrewed aircraft technologies and the collocation of observational ocean assets, among other advancements. Here are five ways that NOAA researchers are improving hurricane track and intensity forecasts:
#1 – Developing of NOAA’s next-generation tropical cyclone model
NOAA recently announced the release of a new and improved tropical cyclone prediction model that will be fully operational this hurricane season. The Hurricane Analysis and Forecasting System (HAFS) is NOAA’s next-generation hurricane model. HAFS aims to provide reliable forecast guidance on tropical cyclone track, intensity, and structure to NOAA’s National Hurricane Center. An important development in HAFS is the inclusion of high-resolution moving nests, a critical component to improve intensity forecasts.
The model was jointly developed, tested, and evaluated by NOAA’s Atlantic Oceanographic & Meteorological Lab, NOAA National Weather Service’s National Centers for Environmental Prediction, in collaboration with NOAA’s Geophysical Fluid Dynamics Laboratory and NOAA’s Cooperative Institute for Marine & Atmospheric Studies at the University of Miami.
Learn more about HAFS in a conversation with the lead meteorologist.
#2 – Collocating ocean observing instruments
For the first time in 2022, NOAA deployed underwater gliders and Saildrones in the same area of the Atlantic Ocean to obtain nearly collocated measurements of the upper ocean and air-sea interface. Because of the strong interaction between the ocean and atmosphere during a hurricane’s passage, better representation from multiple sensors in nearly the same area of the ocean and atmosphere in weather models has led to more accurate intensity forecasts. This season, NOAA and its partners will deploy approximately 20-30 underwater gliders, 12 uncrewed surface vehicles, a small uncrewed aircraft system, and numerous traditional expendable sensors such as GPS dropsondes, which are launched from NOAA hurricane hunter aircraft.
Learn more about the collocated ocean observations from the 2022 hurricane season. Visit the NOAA Ocean Observations Viewer to visualize near real time data collected from various observing systems throughout the season.
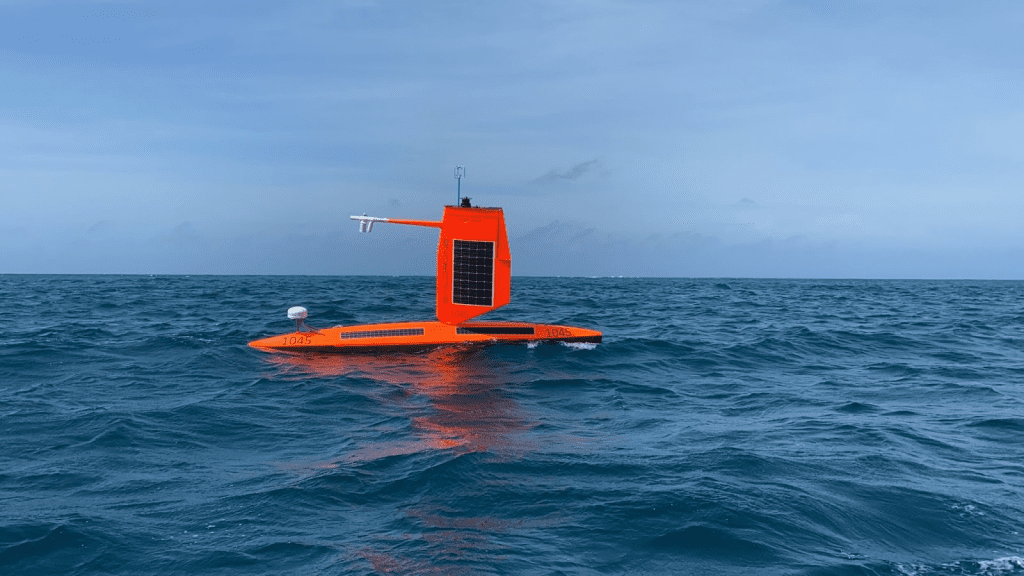
Photo Credit: Saildrone.
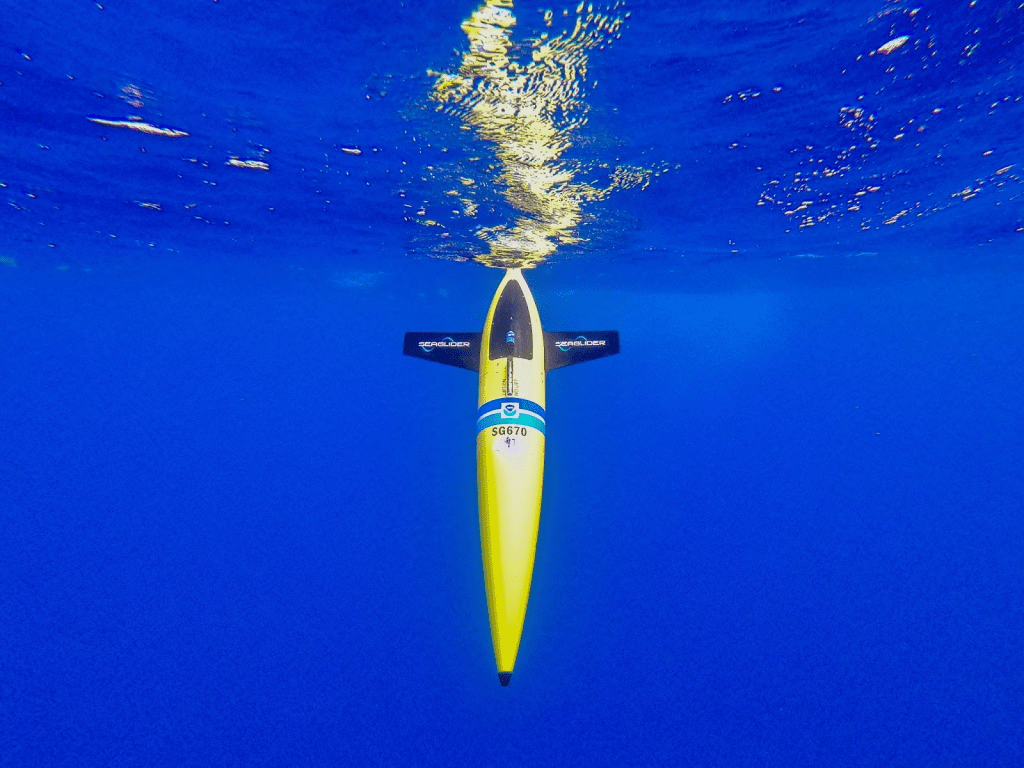
Photo Credit: Allan Jones, Cape Eleuthera Island School.
#3 – Improving small uncrewed aircraft systems
Researchers at NOAA have been deploying small uncrewed aircraft systems (sUAS) into tropical cyclones for almost a decade, beginning with the Coyote into Hurricane Edouard in 2014. During the 2022 hurricane season, an Area-I Altius-600 uncrewed aircraft system was deployed into the eyewall of Category-5 Hurricane Ian before its landfall in southwest Florida. In preparation for the 2023 hurricane season, Area-I and NOAA’s Atlantic Oceanographic & Meteorological Lab are making improvements to the Altius to gather even more high quality data. For example, a new probe has been added to provide more accurate wind data, including the measurement of vertical winds. This will allow researchers to measure how heat from the surface of the ocean sustains a storm. These data-collection advancements are expected to improve the physics and related mathematical processes of the forecast model, which, in turn, will improve intensity forecasts.
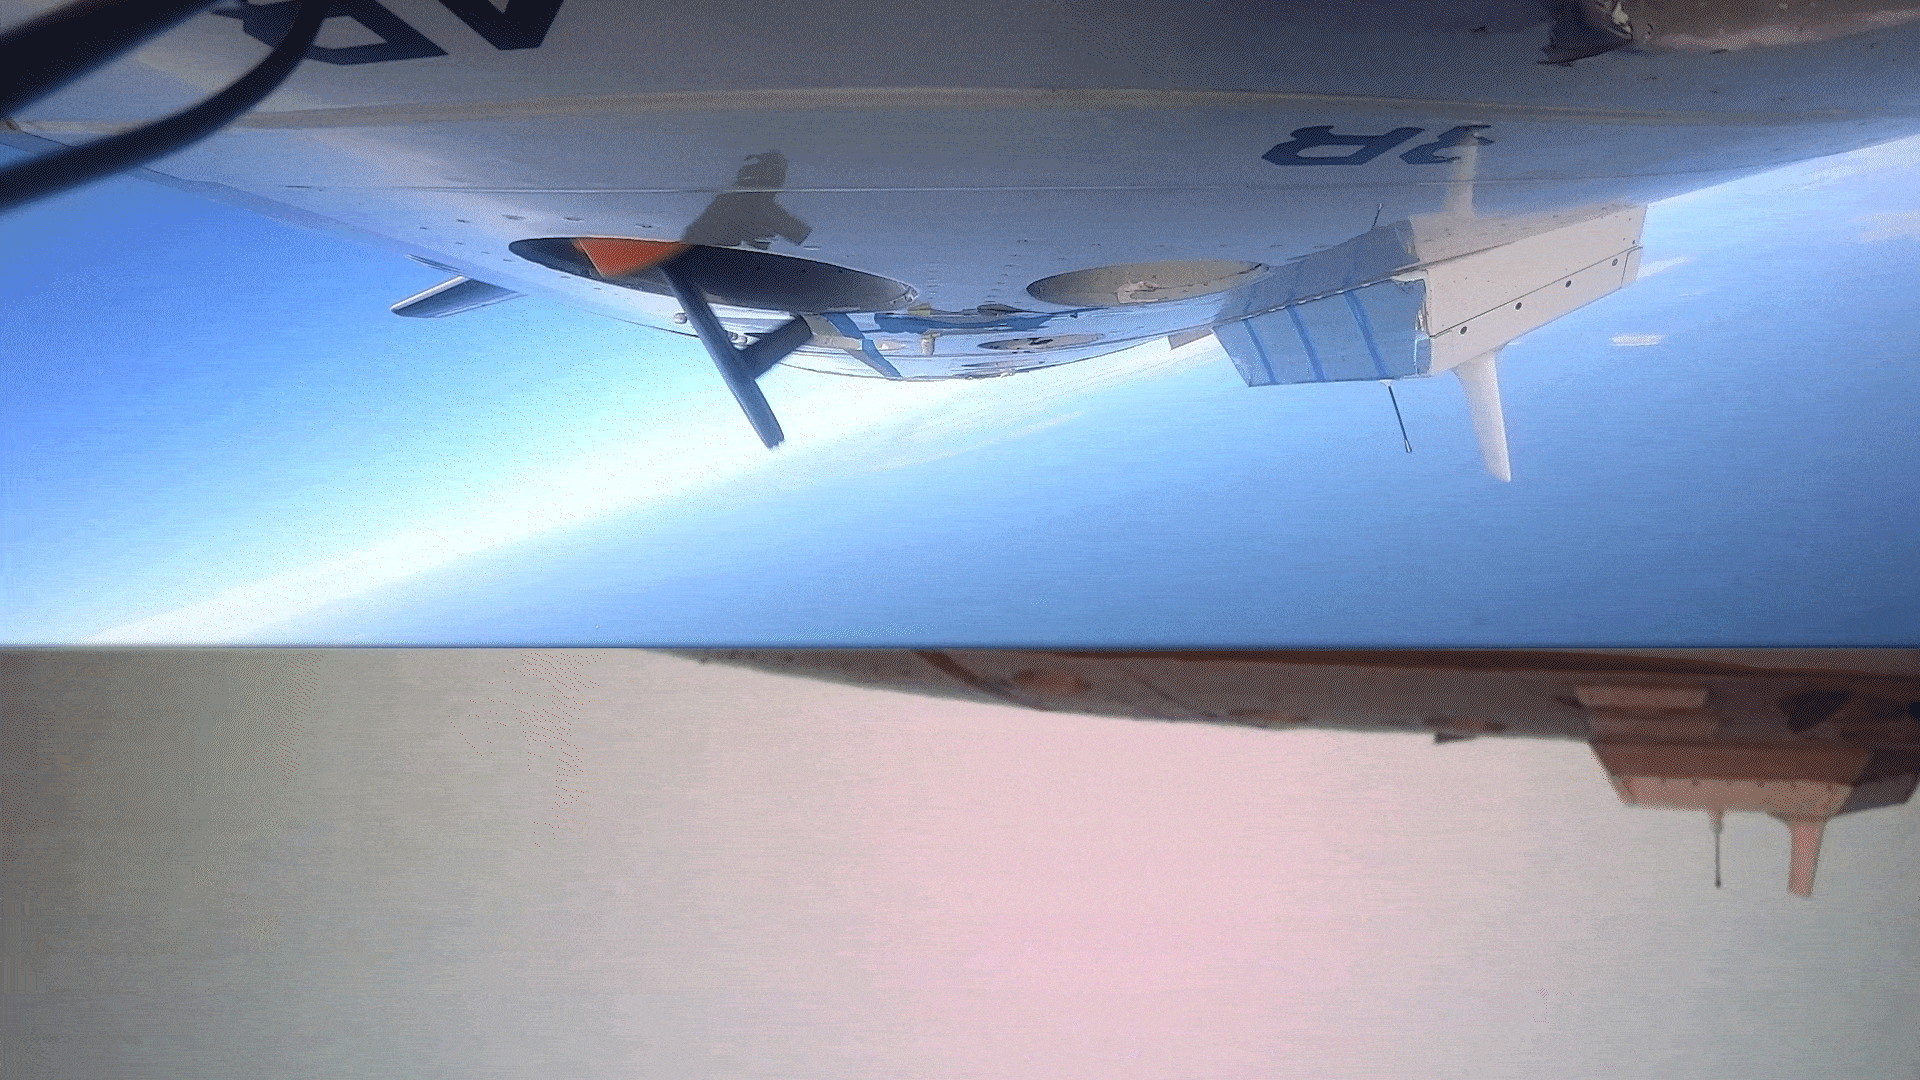
GIF credit: NOAA/AOML
#4 – Developing new instruments
Uncrewed observing platforms such as surface drifters, Argo floats, and air and ocean surface drones are used to measure the most turbulent region of the hurricane environment, called the boundary layer, where the air meets the ocean. Understanding this area is crucial for improving forecast models and providing more advanced targeted warnings to vulnerable communities in harm’s way.
To gather additional data in this hard-to-reach region, NOAA is collaborating with numerous academic partners and small businesses to improve its observational capabilities. This spring, NOAA tested a small uncrewed aircraft system from Black Swift Technologies called the S0, as well as several complementary atmospheric profiling systems from Skyfora called Streamsondes. The S0 is a smaller, more lightweight uncrewed aircraft system than NOAA has used in the past with sensors that measure temperature, pressure, and humidity. The Streamsondes are the lightest weather sondes available and will provide valuable wind data. The tests were conducted from NOAA’s Aircraft Operations Center and are a critical step in ensuring that the instruments perform their data collection tasks in a safe and effective manner during hurricane season.
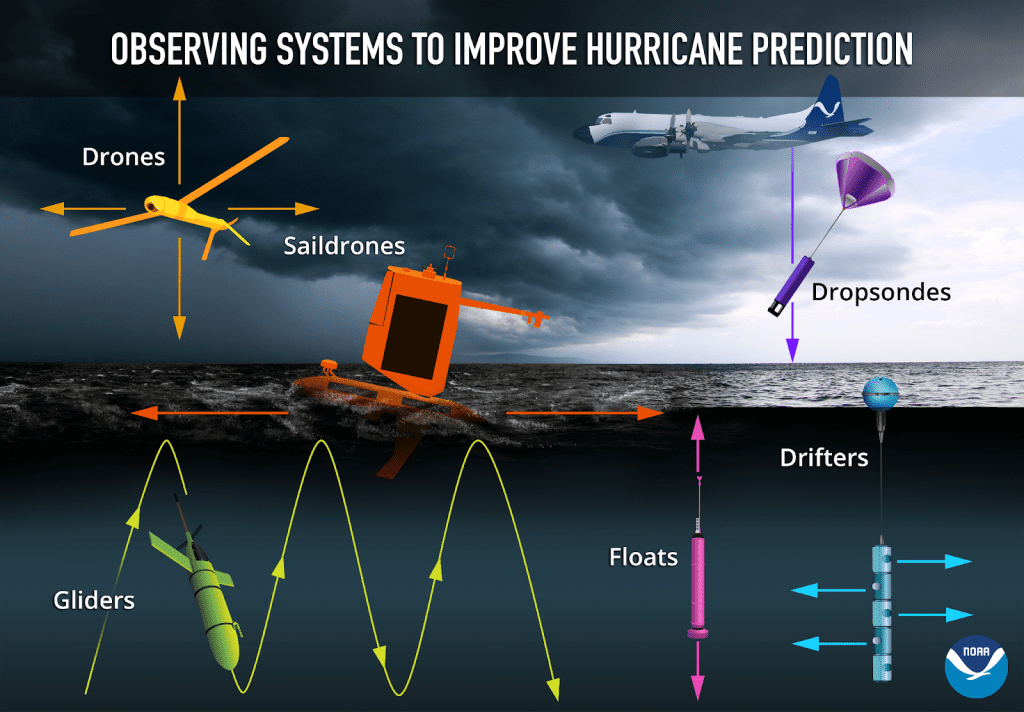
Photo Credit: NOAA/PMEL Observations graphic
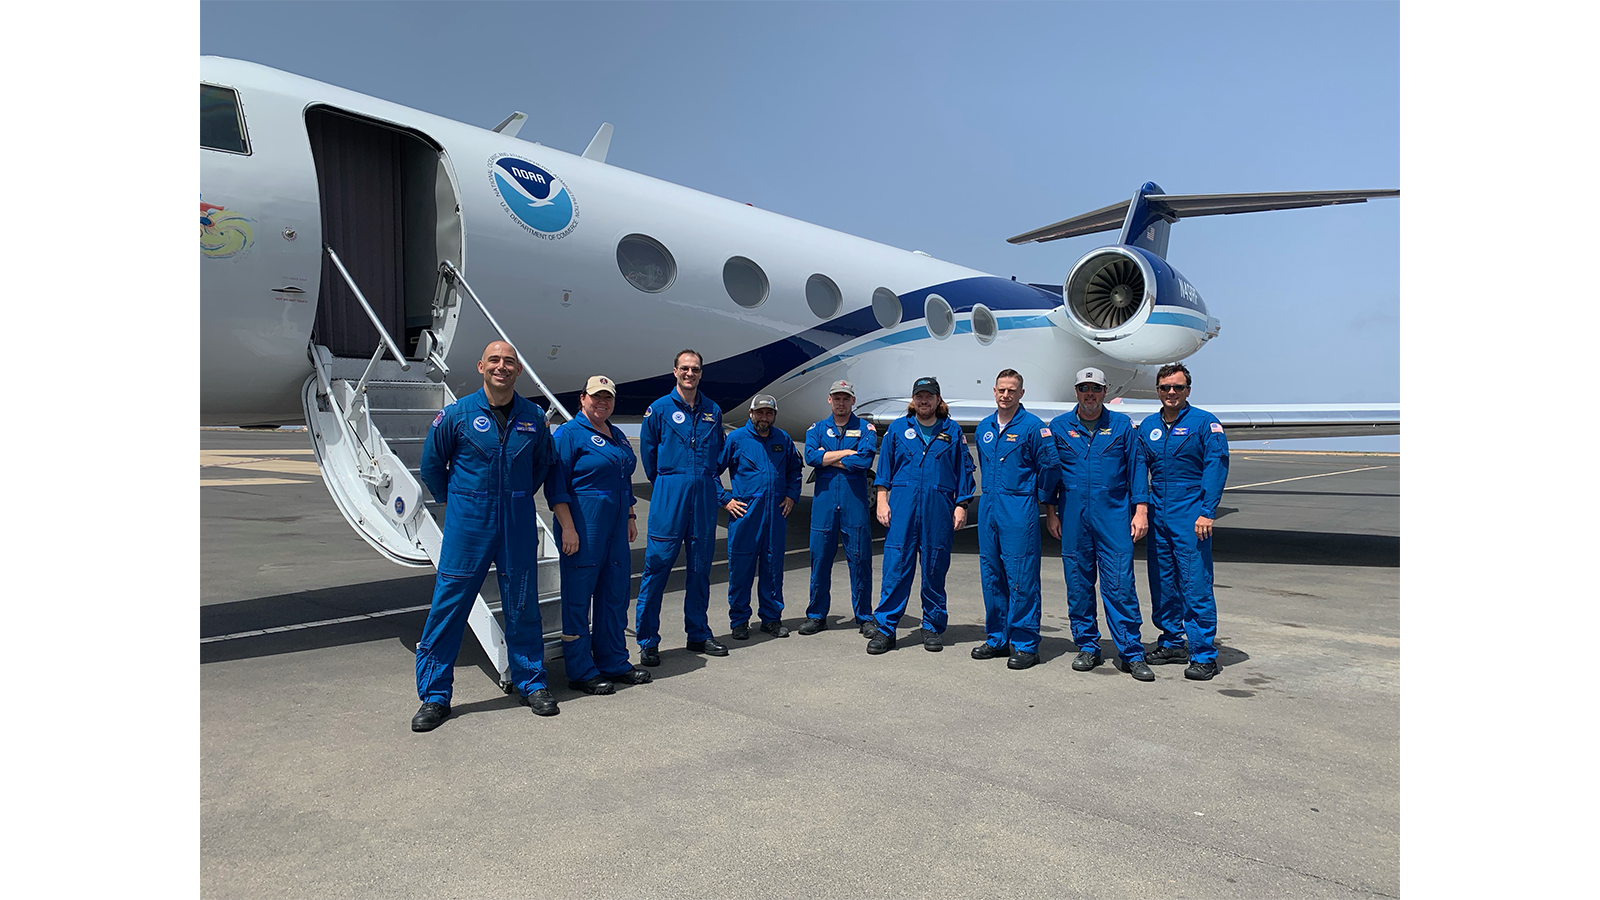
#5 – Flying aircraft further east to study how storms begin
Although the ingredients for tropical cyclone formation have been well-documented for decades, it is still difficult to predict which disturbances will develop and which ones will not. Therefore, NOAA researchers are conducting a suite of experiments specifically designed to better understand how hurricanes develop.
Last summer, researchers deployed to the Cabo Verde islands to explore how tropical waves that move off the coast of West Africa develop into tropical storms and hurricanes. These first-ever missions thousands of miles across the Atlantic marked the farthest distance traveled by NOAA’s Hurricane Hunters to help forecast models better predict the future track and intensity of developing storms. Members of NOAA’s Hurricane Field Program will return to the Cabo Verde islands in 2023 to observe tropical disturbances in the region and collect data to study how Saharan dust blowing off the African coast affects their development.
Learn more about the first Cabo Verde missions.
Photo Credit: NOAA/AOML
For more information, please contact Laura Chaibongsai, at laura.chaibongsai@noaa.gov