Jump to Data
Flight Data by Storm & Year
2026 Flight Data
See Data Per-Storm from the Hurricane Field Program including flight descriptions, patterns, and partners. Visit 2026 Hurricane Data Page.
For experiment descriptions and planning, visit the 2026 Field Program Page.
2025 Flight Data
See Data Per-Storm from the Hurricane Field Program including flight descriptions, patterns, and partners. Visit 2025 Hurricane Data Page.
For experiment descriptions and planning, visit the 2025 Field Program Page.
2024 Flight Data
See Data Per-Storm from the Hurricane Field Program including flight descriptions, patterns, and partners. Visit 2024 Hurricane Data Page.
For experiment descriptions and planning, visit the 2024 Field Program Page.
2023 Flight Data
See Data Per-Storm from the Hurricane Field Program including flight descriptions, patterns, and partners. Visit 2023 Hurricane Data Page.
For experiment descriptions and planning, visit the 2023 Field Program Page.
2022 Flight Data
See Data Per-Storm from the Hurricane Field Program including flight descriptions, patterns, and partners. Visit 2022 Hurricane Data Page.
For experiment descriptions and planning, visit the 2022 Field Program Page.
2021 Flight Data
See Data Per-Storm from the Hurricane Field Program including flight descriptions, patterns, and partners. Visit 2021 Hurricane Data Page.
For experiment descriptions and planning, visit the 2021 Field Program Page.
2020 Flight Data
See Data Per-Storm from the Hurricane Field Program including flight descriptions, patterns, and partners. Visit 2020 Hurricane Data Page.
For 2020 experiment descriptions and planning, visit the 2020 Field Program Page.
2019 Hurricane Season |
||||||||
| Atlantic Basin | ||||||||
| Andrea | Missions | Satellite | SFMR | Track | ||||
| Barry | Missions | Radar | Satellite | Sondes | SFMR | Cloud Physics | Track | |
| TD#03 | Missions | Satellite | SFMR | Track | ||||
| Dorian | Missions | Radar | Satellite | Sondes | SFMR | Cloud Physics | Track | |
| Fernand | Missions | Radar | Satellite | SFMR | Track | |||
| Humberto | Missions | Radar | Satellite | Sondes | SFMR | Cloud Physics | Track | |
| Jerry | Missions | Radar | Satellite | Sondes | SFMR | Cloud Physics | Track | |
| Karen | Missions | Radar | Satellite | SFMR | Cloud Physics | Track | ||
| Lorenzo | Missions | Satellite | Sondes | SFMR | Track | |||
| Nestor | Missions | Radar | Satellite | Sondes | SFMR | Track | ||
| Olga | Missions | Satellite | Track | |||||
| Misc | Missions | |||||||
| East and Central Pacific Basin | ||||||||
| Genesis (pre-Ivo) | Missions | Radar | Satellite | Sondes | SFMR | Cloud Physics | Track | |
| Lorena | Missions | Photos | Radar | Satellite | SFMR | Track | ||
2017 Hurricane Season |
||||||||
| Atlantic Basin | ||||||||
| Bret | Missions | Satellite | Sondes | SFMR | Track | |||
| Cindy | Missions | Satellite | Sondes | SFMR | Track | |||
| Don | Missions | Satellite | Sondes | SFMR | Track | |||
| Franklin | Missions | Radar | Satellite | Sondes | Cloud physics | SFMR | Track | |
| Pot TC 10 | Missions | Satellite | SFMR | |||||
| Harvey | Missions | Photos | Radar | Satellite | Sondes | Cloud physics | SFMR | Track |
| Irma | Missions | Photos | Radar | Satellite | Sondes | Cloud physics | SFMR | Track |
| Jose | Missions | Radar | Satellite | Sondes | Cloud physics | SFMR | Track | |
| Katia | Missions | Satellite | Sondes | SFMR | Track | |||
| Maria | Missions | Photos | Radar | Satellite | Sondes | Cloud physics | SFMR | Track |
| Nate | Missions | Photos | Radar | Satellite | Sondes | Cloud physics | SFMR | Track |
| Philippe | Missions | Satellite | Sondes | SFMR | Track | |||
| Miscellaneous | Missions | Sondes | Cloud physics | |||||
| East and Central Pacific Basin | ||||||||
| Norma | Missions | Satellite | Sondes | SFMR | Track | |||
2016 Hurricane Season |
||||||||
| Atlantic Basin | ||||||||
| Bonnie | Missions | Satellite | Sondes | SFMR | Track | |||
| Colin | Missions | Radar | Satellite | Sondes | SFMR | Track | ||
| Danielle | Missions | Satellite | Sondes | SFMR | Track | |||
| Earl | Missions | Photos | Radar | Satellite | Sondes | SFMR | Track | |
| Trop Dep #08 | Missions | Satellite | Sondes | SFMR | Track | |||
| Hermine | Missions | Radar | Satellite | Sondes | SFMR | Track | ||
| Julia | Missions | Satellite | SFMR | Track | ||||
| Karl | Missions | Photos | Radar | Satellite | Sondes | SFMR | Track | |
| Matthew | Missions | Radar | Satellite | Sondes | SFMR | Track | ||
| Nicole | Missions | Satellite | SFMR | Track | ||||
| AL99 | Missions | Satellite | ||||||
| Otto | Missions | Satellite | SFMR | Track | ||||
| Misc. | Missions | |||||||
| East and Central Pacific Basin | ||||||||
| Darby | Missions | Satellite | Sondes | SFMR | Track | |||
| Javier | Missions | Photos | Radar | Satellite | Sondes | SFMR | Track | |
| Lester | Missions | Satellite | SFMR | Track | ||||
| Madeline | Missions | Satellite | SFMR | Track | ||||
| Newton | Missions | Satellite | SFMR | Track | ||||
2015 Hurricane Season |
||||||||
| Atlantic Basin | ||||||||
| Ana | Missions | Satellite | SFMR | Track | ||||
| Bill | Missions | Satellite | Sondes | SFMR | Track | |||
| Danny | Missions | Radar | Satellite | Sondes | SFMR | Track | ||
| Erika | Missions | Photos | Radar | Satellite | Sondes | SFMR | Track | |
| Joaquin | Missions | Radar | Satellite | Sondes | SFMR | Track | ||
| Kate | Missions | Radar | Satellite | Sondes | SFMR | Track | ||
| Misc. | Missions | Sondes | ||||||
| East and Central Pacific Basin | ||||||||
| Blanca | Missions | Satellite | Sondes | SFMR | Track | |||
| Carlos | Missions | Satellite | Sondes | SFMR | Track | |||
| Ela | Missions | Satellite | Sondes | SFMR | Track | |||
| Guillermo | Missions | Radar | Satellite | Sondes | SFMR | Track | ||
| Hilda | Missions | Satellite | Sondes | SFMR | Track | |||
| Kilo | Missions | Satellite | Sondes | SFMR | Track | |||
| Ignacio | Missions | Satellite | Sondes | SFMR | Track | |||
| Marty | Missions | Satellite | SFMR | Track | ||||
| Oho | Missions | Satellite | Sondes | SFMR | Track | |||
| Patricia | Missions | Photos | Radar | Satellite | Sondes | SFMR | Track | |
2014 Hurricane Season |
||||||||
| Atlantic Basin | ||||||||
| Arthur | Missions | Photos | Radar | Satellite | Sondes | SFMR | Track | |
| TD02 | Missions | Satellite | Sondes | SFMR | ||||
| Bertha | Missions | Photos | Radar | Satellite | Sondes | SFMR | Track | |
| Cristobal | Missions | Photos | Radar | Satellite | Sondes | SFMR | Track | |
| Dolly | Missions | Satellite | Sondes | SFMR | Track | |||
| Edouard | Missions | Photos | Radar | Satellite | Sondes | SFMR | Track | |
| Fay | Missions | Satellite | Sondes | SFMR | Track | |||
| Gonzalo | Missions | Radar | Satellite | Sondes | SFMR | Track | ||
| Hanna | Missions | Satellite | Sondes | SFMR | Track | |||
| Misc. | Missions | Sondes | SFMR | |||||
| East and Central Pacific Basin | ||||||||
| Iselle | Missions | Satellite | Sondes | SFMR | Track | |||
| Julio | Missions | Satellite | Sondes | SFMR | Track | |||
| Norbert | Missions | Satellite | Sondes | Track | ||||
| Odile | Missions | Satellite | Sondes | SFMR | Track | |||
| Polo | Missions | Satellite | Sondes | SFMR | Track | |||
| Simon | Missions | Radar | Satellite | Sondes | SFMR | Track | ||
| Ana | Missions | Radar | Satellite | Sondes | SFMR | |||
2013 Hurricane Season |
||||||||
| Atlantic Basin | ||||||||
| Andrea | Missions | Radar | Satellite | Sondes | SFMR | Track | ||
| Barry | Missions | Radar | Satellite | Sondes | SFMR | Track | ||
| Chantal | Missions | Satellite | Sondes | SFMR | Track | |||
| Dorian | Missions | Satellite | SFMR | |||||
| AL92 | Missions | Photos | Satellite | |||||
| Fernand | Missions | Radar | Satellite | Sondes | SFMR | Track | ||
| Gabrielle | Missions | Photos | Radar | Satellite | Sondes | SFMR | Track | |
| Trop Dep 08 | Missions | Radar | Satellite | Track | ||||
| Ingrid | Missions | Radar | Satellite | Sondes | SFMR | Track | ||
| Karen | Missions | Radar | Satellite | Sondes | SFMR | Track | ||
| Miscellaneous | Missions | Sondes | SFMR | |||||
| East Pacific Basin | ||||||||
| Raymond | Missions | Radar | Satellite | Sondes | SFMR | Track | ||
2012 Hurricane Season |
||||||||
| Atlantic Basin: | ||||||||
| Alberto | Missions | Satellite | Sondes | SFMR | Track | |||
| Beryl | Missions | Satellite | Sondes | SFMR | Track | |||
| Chris | Satellite | |||||||
| Debby | Missions | Satellite | Sondes | SFMR | Track | |||
| Ernesto | Missions | Satellite | Sondes | SFMR | Track | |||
| Helene | Missions | Satellite | Sondes | SFMR | Track | |||
| Isaac | Missions | Photos | Radar | Satellite | Sondes | SFMR | Track | |
| Leslie | Missions | Photos | Radar | Satellite | Sondes | SFMR | Track | |
| Patty | Missions | Satellite | Sondes | SFMR | Track | |||
| Rafael | Missions | Radar | Satellite | Sondes | SFMR | Track | ||
| Sandy | Missions | Photos | Radar | Satellite | Sondes | SFMR | Track | |
| East Pacific Basin: | ||||||||
| Bud | Missions | Satellite | Sondes | SFMR | Track | |||
| Carlotta | Missions | Satellite | Sondes | SFMR | Track | |||
2009 Hurricane Season |
||||||||
| Atlantic Basin: | ||||||||
| Miscellaneous | Missions | AXBT | SFMR | |||||
| Ana | Missions | Radar | Satellite | Sondes | SFMR | Track | ||
| Bill | Missions | Photos | Radar | Satellite | Sondes | SFMR | Track | |
| Claudette | Missions | Satellite | SFMR | Track | ||||
| Danny | Missions | Radar | Satellite | Sondes | AXBT | SFMR | Track | |
| Erika | Missions | Satellite | Sondes | SFMR | Track | |||
| Ida | Missions | Satellite | Sondes | SFMR | Track | |||
| East Pacific Basin: | ||||||||
| Andres | Missions | Satellite | SFMR | Track | ||||
| Felicia | Missions | Satellite | Sondes | SFMR | Track | |||
| Jimena | Missions | Satellite | Sondes | SFMR | Track | |||
| Rick | Missions | Satellite | SFMR | Track | ||||
| West Pacific Basin: | ||||||||
| DOTSTAR | Sondes | |||||||
2008 Hurricane Season |
||||||||
| Atlantic Basin: | ||||||||
| Bertha | Missions | Satellite | Sondes | SFMR | Track | |||
| Cristobal | Missions | Satellite | Sondes | SFMR | Track | |||
| Dolly | Missions | Radar | Satellite | Sondes | SFMR | Track | AXBT | |
| Edouard | Missions | Satellite | Sondes | SFMR | Track | |||
| Fay | Missions | Radar | Satellite | Sondes | SFMR | Track | ||
| Gustav | Missions | Photos | Radar | Satellite | Sondes | SFMR | Track | AXBT |
| Hanna | Missions | Satellite | Sondes | SFMR | Track | |||
| Ike | Missions | Photos | Radar | Satellite | Sondes | SFMR | Track | AXBT |
| Kyle | Missions | Photos | Radar | Satellite | Sondes | SFMR | Track | |
| Invest | Missions | SFMR | ||||||
| Marco | Missions | Satellite | Track | |||||
| Omar | Missions | Satellite | Sondes | SFMR | Track | |||
| TropDep#16 | Missions | Satellite | SFMR | Track | ||||
| Paloma | Missions | Photos | Radar | Satellite | Sondes | SFMR | Track | |
| East Pacific Basin: | ||||||||
| Alma | Satellite | |||||||
| Norbert | Missions | Satellite | Sondes | SFMR | Track | |||
| Odile | Missions | Satellite | Sondes | Track | ||||
| West Pacific Basin: | ||||||||
| DOTSTAR | ||||||||
| TPARC-2008 | ||||||||
| Jangmi | Missions | Track | ||||||
2007 Hurricane Season |
||||||||
| Atlantic Basin: | ||||||||
| Andrea | Missions | Satellite | Sondes | Track | ||||
| Barry | Missions | Satellite | Sondes | Track | ||||
| Chantal | Satellite | |||||||
| Dean | Missions | Satellite | Sondes | Track | ||||
| Erin | Missions | Radar | Satellite | Track | ||||
| Felix | Missions | Photos | Radar | Satellite | Sondes | SFMR | Track | |
| Gabrielle | Missions | Satellite | Sondes | Track | ||||
| Humberto | Missions | Satellite | Sondes | Track | ||||
| Ingrid | Missions | Radar | Satellite | Sondes | SFMR | Track | ||
| TD 10 | Missions | Radar | Satellite | Sondes | SFMR | Track | ||
| Karen | Missions | Radar | Satellite | Sondes | SFMR | Track | ||
| Lorenzo | Missions | Satellite | Sondes | Track | ||||
| Noel | Missions | Radar | Satellite | Sondes | SFMR | Track | ||
| Olga | Missions | Satellite | Sondes | |||||
| East Pacific Basin: | ||||||||
| Flossie | Missions | Satellite | Sondes | Track | ||||
| West Pacific Basin: | ||||||||
| DOTSTAR | ||||||||
2006 Hurricane Season |
||||||
| Atlantic Basin: | ||||||
| Alberto | Missions | Satellite | Sondes | SFMR | Track | |
| Beryl | Missions | Satellite | Sondes | Track | ||
| Chris | Missions | Satellite | Sondes | Track | ||
| Debby | Missions | Satellite | Sondes | |||
| Ernesto | Missions | Radar | Satellite | Sondes | SFMR | Track |
| Florence | Missions | Satellite | Sondes | Track | ||
| Gordon | Missions | Satellite | Track | |||
| Helene | Missions | Radar | Satellite | Sondes | SFMR | Track |
| SALEX | Missions | Satellite | Sondes | |||
| NAMMA | Missions | Sondes | ||||
| East Pacific Basin: | ||||||
| John | Missions | Satellite | Sondes | Track | ||
| Lane | Missions | Satellite | Sondes | Track | ||
| Paul | Missions | Satellite | Sondes | Track | ||
| West Pacific Basin: | ||||||
| DOTSTAR | ||||||
2004 Hurricane Season |
|||||||||
| Atlantic Basin: | |||||||||
| Calibration | Missions | Satellite | |||||||
| Alex | Missions | Satellite | Track | ||||||
| Bonnie | Missions | Satellite | Sondes | Track | |||||
| Charley | Missions | Satellite | Sondes | Track | |||||
| Earl | Missions | Satellite | Track | ||||||
| Frances | Missions | Radar | Satellite | Sondes | AXBT | SFMR | Track | ||
| Gaston | Missions | Satellite | Track | ||||||
| Ivan | Missions | Photos | Radar | Satellite | Sondes | SFMR | Track | ||
| Jeanne | Missions | Photos | Radar | Satellite | Sondes | AXBT | SFMR | Track | |
| Matthew | Missions | Track | |||||||
| East Pacific Basin: | |||||||||
| Estelle | Missions | Satellite | Track | ||||||
| Lester | Missions | Satellite | |||||||
| West Pacific Basin: | |||||||||
| DOTSTAR | |||||||||
2003 Hurricane Season |
|||||||||
| Atlantic Basin: | |||||||||
| Bill | Missions | Satellite | Sondes | Track | |||||
| Claudette | Missions | Satellite | Sondes | Track | |||||
| Erika | Missions | Satellite | Sondes | Track | |||||
| Calibration | Missions | Photos | |||||||
| Fabian | Missions | Photos | Radar | Satellite | Sondes | SFMR | AXBT | Track | |
| Grace | Missions | Sondes | Track | ||||||
| TropDep#9 | Missions | Sondes | |||||||
| Henri | Missions | Satellite | Sondes | Track | |||||
| Isabel | Missions | Photos | Radar | Satellite | Sondes | SFMR | Track | ||
| Juan | Sondes | ||||||||
| Larry | Missions | Satellite | Sondes | Track | |||||
| Mindy | Missions | Satellite | Sondes | Track | |||||
| Odette | Missions | Photos | Radar | Satellite | Sondes | Track | |||
| East Pacific Basin: | |||||||||
| Jimena | Missions | Sondes | Track | ||||||
| Linda | Satellite | ||||||||
| Olaf | Missions | Satellite | Sondes | Track | |||||
| West Pacific Basin: | |||||||||
| DOTSTAR | |||||||||
2002 Hurricane Season |
||||||||
| Atlantic Basin: | ||||||||
| Calibration | Missions | Photos | Sondes | |||||
| Bertha | Missions | Satellite | Sondes | Track | ||||
| Cristobal | Missions | Sondes | Track | |||||
| Edouard | Missions | Photos | Radar | Satellite | Sondes | SFMR | Track | |
| Fay | Missions | Photos | Satellite | Sondes | Track | |||
| Gustav | Missions | Radar | Satellite | Sondes | Track | |||
| Hanna | Missions | Radar | Satellite | Sondes | Track | |||
| Isidore | Missions | Radar | Satellite | Sondes | SFMR | Track | ||
| Kyle | Missions | Sondes | Track | |||||
| Lili | Missions | Radar | Satellite | Sondes | SFMR | Track | ||
| Trop Dep #14 | Missions | Satellite | Sondes | Track | ||||
| East Pacific Basin: | ||||||||
| WSR2002 | Sondes | |||||||
| Kenna | Missions | Track | ||||||
2001 Hurricane Season |
||||||||||
| Atlantic Basin: | ||||||||||
| CAMEX-4 (NASA) | Missions | Radar | Sondes | |||||||
| Allison | Missions | Satellite | Track | |||||||
| Barry | Missions | Sondes | Satellite | Track | ||||||
| Chantal | Missions | Radar | Sondes | Satellite | Pass | Track | ||||
| Dean | Missions | Satellite | Track | |||||||
| Erin | Missions | Radar | Sondes | Photos | Satellite | Pass | Track | |||
| Gabrielle | Missions | Radar | Sondes | Photos | Satellite | Track | ||||
| Humberto | Missions | Radar | Sondes | Photos | Satellite | Pass | Track | AXBT | SFMR | |
| Iris | Missions | Radar | Sondes | Satellite | Track | |||||
| Jerry | Missions | Satellite | Track | |||||||
| Karen | Sondes | |||||||||
| Michelle | Missions | Radar | Sondes | Satellite | Pass | Track | ||||
| East Pacific Basin: | ||||||||||
| WSR2001 | Sondes | |||||||||
| EPIC | Sondes | |||||||||
| Juliette | Missions | Satellite | Track | |||||||
| Lorena | Missions | Satellite | ||||||||
1998 Hurricane Season |
|||||||||||
| Atlantic Basin: | |||||||||||
| Alex | Missions | Targeting | Satellite | Track | |||||||
| Bonnie | Missions | Radar | Targeting | Sondes | AXBTs | SST | Satellite | Pass | SFMR | Track | |
| Charley | Missions | Satellite | Track | ||||||||
| Danielle | Missions | Radar | Cloud Physics | Targeting | Sondes | AXBTs | Satellite | Pass | SFMR | Track | |
| Earl | Missions | Radar | Cloud Physics | Sondes | AXBTs | Satellite | SFMR | Track | |||
| Frances | Targeting | Sondes | Satellite | ||||||||
| Georges | Missions | Radar | Cloud Physics | Targeting | Sondes | AXBTs | Satellite | Pass | SFMR | Track | |
| Hermine | Missions | Targeting | Satellite | Track | |||||||
| Lisa | Targeting | ||||||||||
| Mitch | Missions | Radar | Targeting | Sondes | Satellite | Pass | Track | ||||
| East Pacific Basin: | |||||||||||
| Lester | Missions | Satellite | Track | ||||||||
| Madeline | Missions | Track | |||||||||
| NORPEX | Sondes | ||||||||||
1997 Hurricane Season |
|||||||||
| Atlantic Basin: | |||||||||
| ADEOS | Sondes | ||||||||
| FASTEX | Sondes | ||||||||
| Ana | Missions | Track | |||||||
| Bill | Missions | Track | |||||||
| Claudette | Missions | Sondes | Track | ||||||
| Danny | Missions | Radar | Sondes | Satellite | Track | ||||
| Tropical Depression #5 | Missions | Sondes | Track | ||||||
| Erika | Missions | Radar | Sondes | AXBT | Track | ||||
| East Pacific Basin: | |||||||||
| Guillermo | Missions | Radar | Sondes | Pass Data | Track | ||||
| Linda | Missions | Sondes | |||||||
| West Pacific Basin: | |||||||||
| Paka | Photos | ||||||||
1996 Hurricane Season |
|||||
| Atlantic Basin: | |||||
| Arthur | Missions | Pass Data | Track | ||
| Bertha | Missions | Pass Data | Track | ||
| Cesar | Missions | Pass Data | Track | ||
| Dolly | Missions | Radar | Pass Data | Sondes | Track |
| Edouard | Missions | Radar | Pass Data | Sondes | Track |
| Fran | Missions | Radar | Pass Data | Sondes | Track |
| Hortense | Missions | Radar | Pass Data | Track | |
| Josephine | Missions | Radar | Pass Data | Sondes | Track |
| Kyle | Missions | Pass Data | Track | ||
| Lili | Missions | Radar | Pass Data | Track | |
| Marco | Missions | Pass Data | Sondes | Track | |
1995 Hurricane Season |
||||
| Atlantic Basin: | ||||
| Allison | Missions | Pass Data | Track | |
| Barry | Missions | Track | ||
| Chantal | Missions | Pass Data | Track | |
| Dean | Missions | Track | ||
| Erin | Missions | Radar | Pass Data | Track |
| TD06 | Missions | Track | ||
| Felix | Missions | Radar | Pass Data | Track |
| Gabrielle | Missions | Track | ||
| Iris | Missions | Radar | Pass Data | Track |
| Jerry | Missions | Radar | Track | |
| Luis | Missions | Radar | Pass Data | Track |
| Marilyn | Missions | Radar | Pass Data | Track |
| Opal | Missions | Radar | Pass Data | Track |
| Roxanne | Missions | Pass Data | Track | |
1994 Hurricane Season |
||||||
| Atlantic Basin: | ||||||
| Chris | Missions | Radar | ||||
| Debby | Missions | Radar | Pass Data | |||
| Gordon | Missions | Pass Data | ||||
| East Pacific Basin: | ||||||
| Olivia | Missions | Radar | Photo | Satellite | Pass Data | Track |
Models & Visualization Products
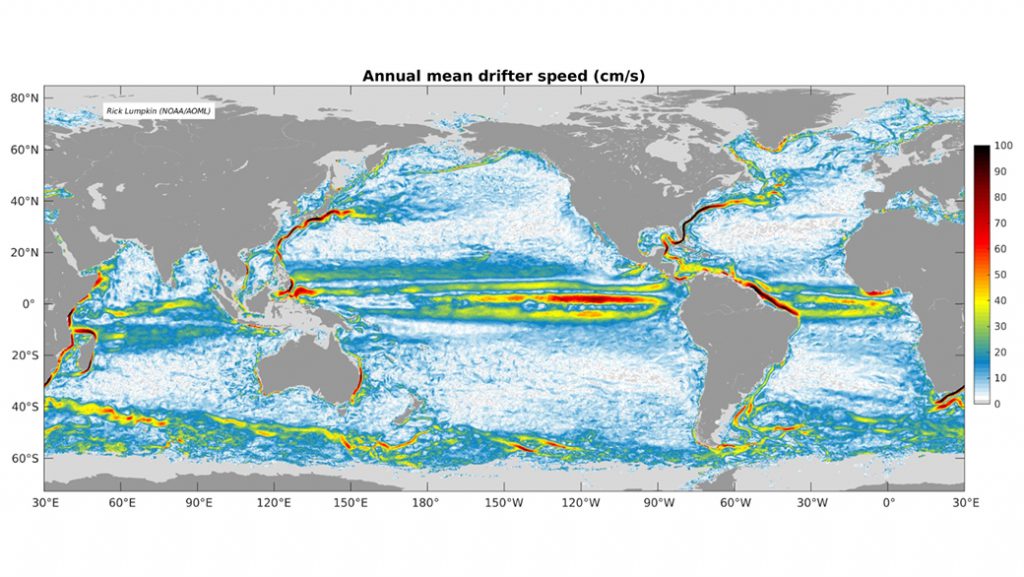
Global Drifter Data
Data from global drifter program buoys is available in various formats. Links and a brief description on how to access drifter data can be found at on the Drifter Data Page.
For a complete list of Global Drifter Program products and resources, please visit the Drifter Homepage.
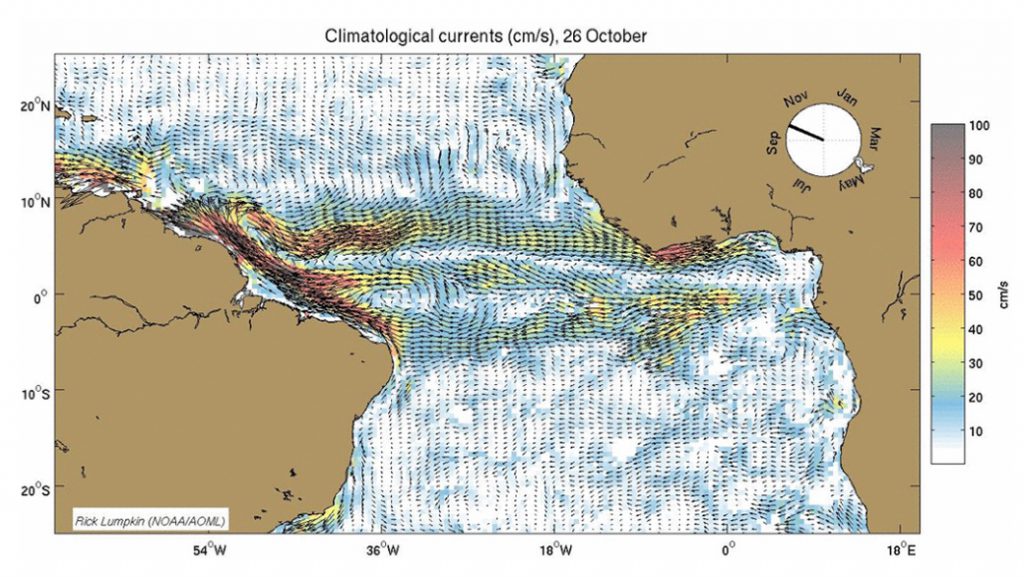
A climatology of near-surface currents and temperature for the world, at monthly and 1/4-degree resolution, derived from satellite-tracked surface drifting buoy observations can be found at the Drifter-Derived Climatology Page.
For a complete list of Global Drifter Program products & resources, please visit the Drifter Homepage.
Regional animations of near-surface currents and temperatures, at monthly 1/4-degree resolution can be found at the Drifter Animations Page.
For a complete list of Global Drifter Program products & resources, please visit the Drifter Homepage.
Satellite Data
NOAA/AOML distributes on its web server several products for ocean and weather studies. The data used to derive these products come from a wide array of observing platforms. Satellite-derived sea height anomaly (SHA) and sea surface temperature (SST), temperature profiles from profiling floats and expendable bathythermographs (XBTs), and surface currents from drifters are used to develop these products.
Hover over/tap image to see more.
Argo Data
Argo is a long-term ocean observation program that measures temperature and salinity in the upper 2,000m of the ocean providing 100,000 T/S profiles and reference velocity measurements per year. This broad-scale global array of profiling floats has already grown to be a major component of the ocean observing system. It has changed the way scientists think about collecting data and has prompted other discussions about international collaboration in the scientific community. This kind of data is crucial for weather forecasts and it provides information related to climate and biology of the ocean. The Argo community has a web portal to access project information. Visit it by going to the portal below.
PIRATA Northeast Extension
The PIRATA Northeast Extension (PNE) project is a joint AOML and PMEL effort to expand the PIRATA array of tropical Atlantic ATLAS moorings into the northern and northeastern sectors of the Tropical Atlantic Ocean. Links below provide more information on PIRATA, the climate significance of the Tropical North Atlantic, PNE cruises, and related projects such as AMMA, TACE and AEROSE.
Western Boundary Time Series
This project consists of two components to monitor the western boundary currents in the subtropical Atlantic: the Florida Current transport measurements using a submarine telephone cable plus calibration cruises and the Deep Western Boundary Current transport and property measurements using dedicated research ship time and moorings.
South Atlantic Meridional Overturning Circulation
Several projects, which include analysis of in-situ observations, satellite observations, and modelling efforts, are being carried out at PhOD to monitor and investigate the variability of the MOC in the South Atlantic. In addition, a series of international workshops were conducted to discuss how the present observation systems may contribute to estimate the meridional and inter-basin fluxes of mass, heat and salt; how the present array ought to be upgraded to better capture these fluxes and their variability; and how to transition from the initial array to a long-term sustained program.
The Global Carbon Cycle
AOML participates in NOAA’s Global Carbon Cycle Program by assessing the oceans role in controlling atmospheric carbon dioxide (CO2). We focus on the exchange of CO2 between the air and the ocean surface and how it gets to the deep ocean. The Global Carbon Cycle data includes measurements of dissolved inorganic compounds (DIC) from long-line and short cruises and partial pressure of CO2 (pCO2) from Ships of Opportunity and NOAA ships.
Hover over image to see more.
State of the Ocean Observing System
Every year, the Office of Climate Observations (OCO) at OGP/NOAA publishes an Annual Report on the State of the Ocean and the Ocean Observing System for Climate. This Annual Report provides an overview of the ocean, its role in climate, and the connections between ocean observations and economic and societal impact, based on the observations collected and analysis performed as part of the NOAA Ocean Observing System.
AOML contributes to the OCO’s report through its varied data collection efforts, and as of 2005, through Quarterly Reports on certain key ocean state variables: Global Heat Storage, Global Surface Currents, and Atlantic Meridional Heat Transport. Visit the Portal below.

A suite of key ocean indicators and indexes are computed at AOML using hydrographic and satellite observations. They provide information about ocean heat content, sea surface temperature, and ocean currents variability, and can be used to monitor and assess the current state of the ocean. If you would like to receive a file with the data of these indexes and indicators, please contact the investigators leading each specific work.

AOML studies the Meridional Overturning Circulation (MOC) in the north and south Atlantic. This research allows us to learn about the structure of the different currents and gyres that distribute the heat within the Atlantic Ocean, and how they change over time.
South Florida Ecosystem Restoration Data
The saltwater recreational fishery adjacent to the Everglades generates approximately $880 million and greater then 6,000 jobs per year. This area includes Florida Bay, which not only supports a substantial recreational fishing industry within its waters, but also serves as a nursery ground for many of the adjacent commercial and recreational reef fishery species. These commercial and recreational fishery species within Florida Bay will be affected by Everglades restoration as it aims to restore Florida Bay to a less disturbed state by minimizing hypersalinity. One of the best indicators for estuarine health is spotted seatrout (Cynscion nebulosus). Cynscion nebulosus is a good indicator, because it spends its entire life within the bay it was spawned and is sensitive to fluctuations in water quality including salinity. Additionally, Cynscion nebulosus is the second most commonly caught sportfish in Florida Bay, accounting for approximately 30% of all catch.

We have partnered with NOAA’s Southeast Fisheries Science Center (NOAA/SEFSC) to investigate how juvenile sportfish in Florida Bay respond to water quality and habitat. This project conducts otter trawls to sample the juvenile sportfish populations, along with water quality and seagrass measurements in Florida Bay. The objectives are to:
- Develop reference conditions that can be used as a baseline to evaluate trends in juvenile spotted seatrout populations and quantify the impacts of Everglades Restoration;
- Develop a juvenile abundance index (mean abundance and frequency of occurrence) and determine if annual differences in abundance occur among areas in the Bay;
- Examine the relationship between juvenile spotted seatrout abundance, salinity, temperature, and seagrass; use this analysis to gain insights into the potential response of spotted seatrout to the Comprehensive Everglades Restoration Plan (CERP); and
- Determine the salinity preferences for other juvenile sportfish species in Florida Bay.
Learn with our Spotting the Seatrout storymap or download the Juvenile Sportfish Survey Data.*
*Downloads an .xlsx workbook.
Data taken from the South Florida Ecosystem Restoration Research Cruises aboard the University of Miami’s R/V Walton Smith can be found here. These shipboard data sets are freely available for academic, research, or professional purposes under certain terms* Click the links to download the bay-wide and regional data sets below (.xls format).
*Data Use Terms: The user shall notify designated NOAA-AOML South Florida Program (SFP) researchers when any future work based on or derived from this data is published. The User agrees not to redistribute original NOAA-AOML South Florida Program (SFP) data. The User will acknowledge the support of the NOAA-AOML South Florida Program (SFP) in any publication using these data with the following citation: ‘Data were provided by the NOAA-AOML South Florida Program. The user agrees to send two reprints of any publication resulting from the use of these data and/or documentation to both Chris Kelble.
Coral Data
The National Coral Reef Monitoring Program is co-funded by NOAA’s Coral Reef Conservation Program and Ocean Acidification Program. Our goal is to provide sustained and long‐term measurement of key variables to gauge the status and trends of coral reef health. We are leading the in-situ climate change and ocean acidification monitoring for the Atlantic Ocean in collaboration with NOAA’s Pacific Marine Environmental Laboratory in Seattle, Washington and the Pacific Islands Fisheries Science Center in Honolulu, Hawaii. This includes monitoring of seawater temperatures and the progression of ocean acidification, as well as the ecological impacts of these variables, at key sites. This monitoring is being conducted at sites in the U.S. Virgin Islands, Puerto Rico, Florida, and the Flower Garden Banks.
Each sentinel site has a moored autonomous pCO2 (MApCO2) buoy that measures the partial pressure of CO2 (pCO2) in seawater, temperature, salinity and pH every three hours and relays these data in near-real-time. These efforts are part of and adhere to the data quality requirements of the larger Global Ocean Acidification Monitoring Network. Some of the key ecosystem variables being measured at each sentinel site to gauge the impacts of climate change and ocean acidification are:
Ecosystem and species-specific calcification rates
Calcium carbonate budgets
Bioerosion rates
Omics Data
The Omics program at AOML works to promote coral resilience, develop and transfer emerging technologies, advance Omics for fisheries and microbiome applications, and foster the bioinformatics and infrastructure capabilities upon which all Omics research and operations rely. This work engages coral, fisheries, and microbiome experts across the agency and through international engagement. See published data below.
Click the buttons below each project to access the data. To access the code associated with our research projects, visit our Visit Github Account.
The Microbiome of Disease Resistant and Susceptible Acropora
In this study, we aimed to evaluate the microbiomes of corals that were tested for disease resilience and susceptibility in nursery-reared Caribbean Acropora spp. Diseased coral were grafted onto healthy fragments and diseased fragments may have harbored distinct pathogens. In 2017, three histological samples were examined that suggested that disease fragments were causing rapid tissue loss. To identify potential disease agents and identify bacteria associated with resilience we used 16S rRNA high-throughput sequencing to evaluate these data.
The Earth Microbiome Project
The Earth Microbiome Project (EMP) is a systematic attempt to characterize global microbial taxonomic and functional diversity for the benefit of the planet and humankind. Most of the data generated to this point are from 16S rRNA amplicon sequencing, but the project also includes data from 18S and ITS amplicon sequencing, metagenomics, and metabolomics. An analysis of the first 27,000 samples, with insights about the global distribution of bacteria and archaea, was published in Nature in 2017. More information about the project is found at earthmicrobiome.org.
Red Sea Single-Cell Genomes
This project contains new microbial genomes and an analysis of these genomes in the context of global ocean metagenomes and metatranscriptomes. Reported are 21 new SAR11 single-cell genomes, including the first genomes from subclades Ib and Id, and 5 new Prochlorococcus single-cell genomes from ecotype HLII. A new method called “OG ordination” is introduced which uses PCA of ortholog group (OG) composition to resolve phylogenetic differences in closely related genomes. Tara Oceans metagenomes are discriminated based on the distribution of Prochlorococcus and SAR11 OGs. Finally, the Baas Becking hypothesis applied to OGs is tested, showing that most OGs from surface ocean Prochlorococcus and SAR11 are distributed widely across the surface ocean.