

Featured Projects

Hurricane Field Program Plan
Experiments, Flight Plans and
Operational Maps for 2026
Hurricane Field Program Data
Missions, Flight Tracks, and
Observational data for 2025
Models & Visualizations
Research Capability & Expertise
News & Events


June 2, 2026
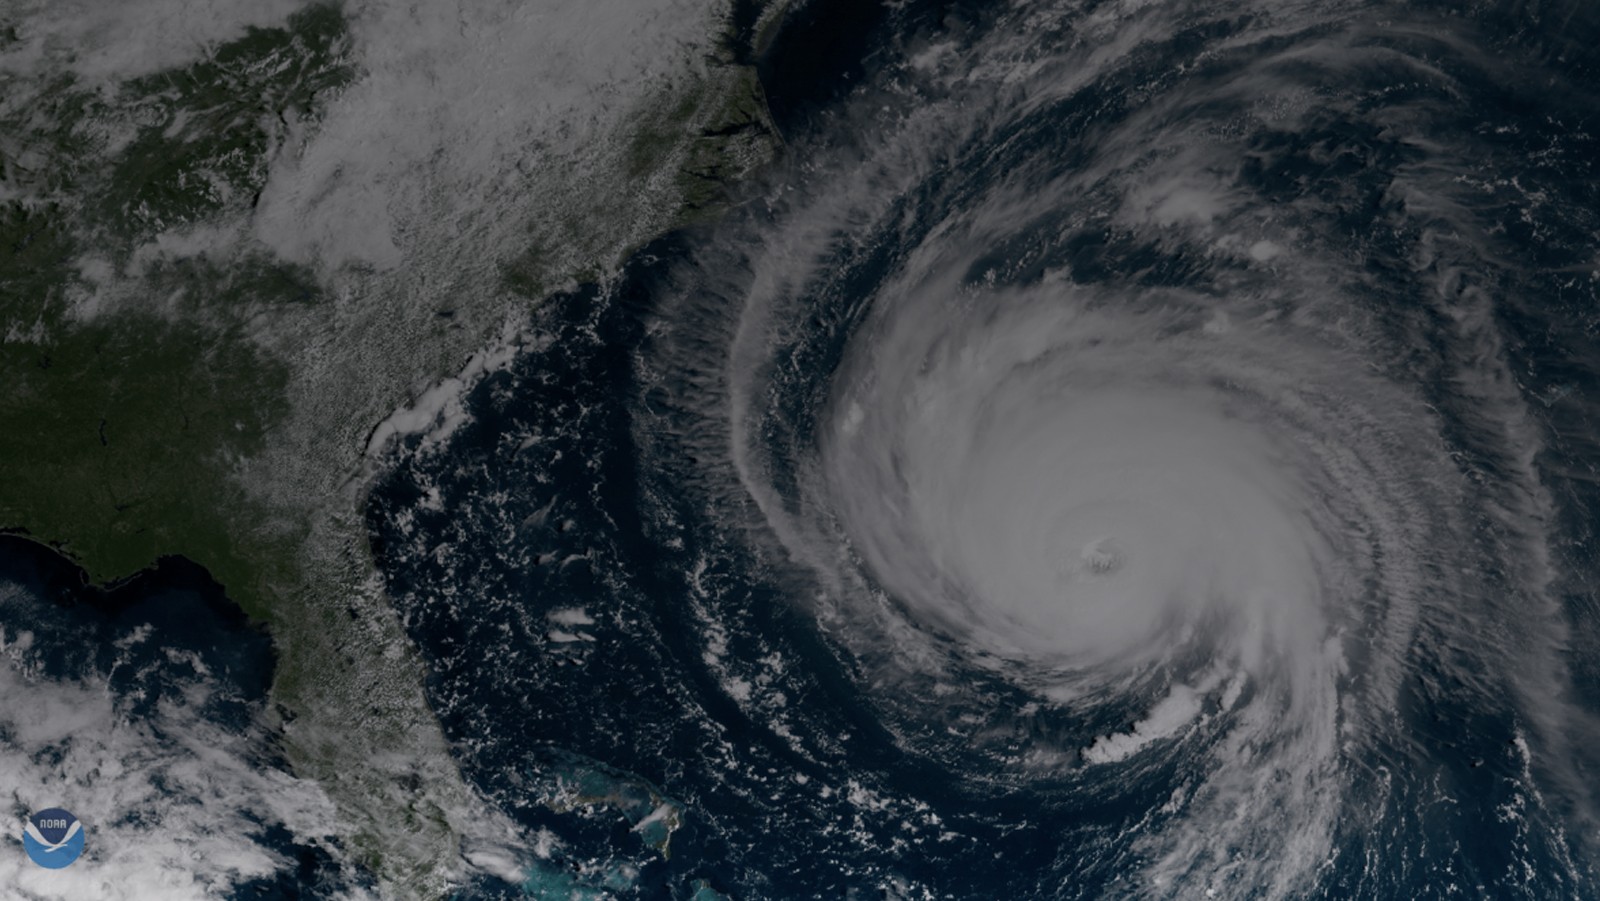
NOAA has released their seasonal outlook for the 2026 hurricane season – spanning from June 1st to November 30th – reporting a 55% probability of a below average season. This prediction is primarily driven by several factors including a strong El Niño event expected to emerge in the Pacific basin. This phenomenon will disrupt typical […]
Improvements in Forecasting, Weather, Floods and Hurricanes
Providing Research to Make Forecasts Better
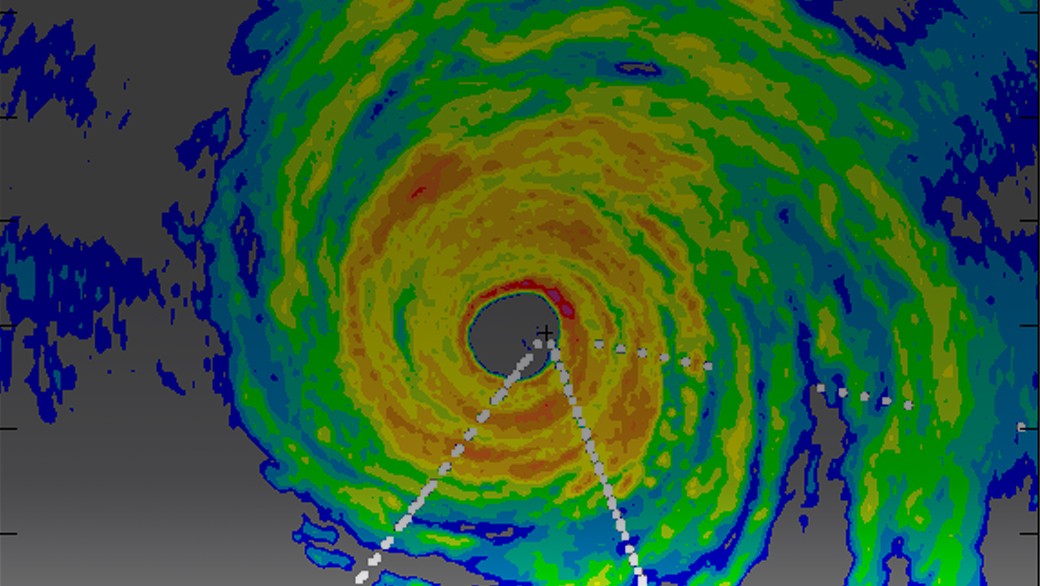
This overview report includes work on the Hurricane Analysis and Forecasting System (HAFS), a set of moving, high-resolution nests around tropical cyclones in the global weather model, and the AOML Hurricane Model Viewer.

Featured Publication

Alaka Jr, G. J., Zhang, X., & Gopalakrishnan, S. G. (2022). High-definition hurricanes: improving forecasts with storm-following nests. Bulletin of the American Meteorological Society, 103(3), E680-E703.
Abstract: To forecast tropical cyclone (TC) intensity and structure changes with fidelity, numerical weather prediction models must be “high definition,” i.e., horizontal grid spacing ≤ 3 km, so that they permit clouds and convection and resolve sharp gradients of momentum and moisture in the eyewall and rainbands. Storm-following nests are computationally efficient at fine resolutions, providing a practical approach to improve TC intensity forecasts. Under the Hurricane Forecast Improvement Project, the operational Hurricane Weather Research and Forecasting (HWRF) system was developed to include telescopic, storm-following nests for a single TC per model integration.
High-Definition Hurricanes: Improving Forecasts with Storm-Following Nests
Alaka Jr, G. J., Zhang, X., & Gopalakrishnan, S. G. (2022). High-definition hurricanes: improving forecasts with storm-following nests. Bulletin of the American Meteorological Society, 103(3), E680-E703.
Abstract: To forecast tropical cyclone (TC) intensity and structure changes with fidelity, numerical weather prediction models must be “high definition,” i.e., horizontal grid spacing ≤ 3 km, so that they permit clouds and convection and resolve sharp gradients of momentum and moisture in the eyewall and rainbands. Storm-following nests are computationally efficient at fine resolutions, providing a practical approach to improve TC intensity forecasts. Under the Hurricane Forecast Improvement Project, the operational Hurricane Weather Research and Forecasting (HWRF) system was developed to include telescopic, storm-following nests for a single TC per model integration.

Looking for scientific literature? Visit our Publication Database.
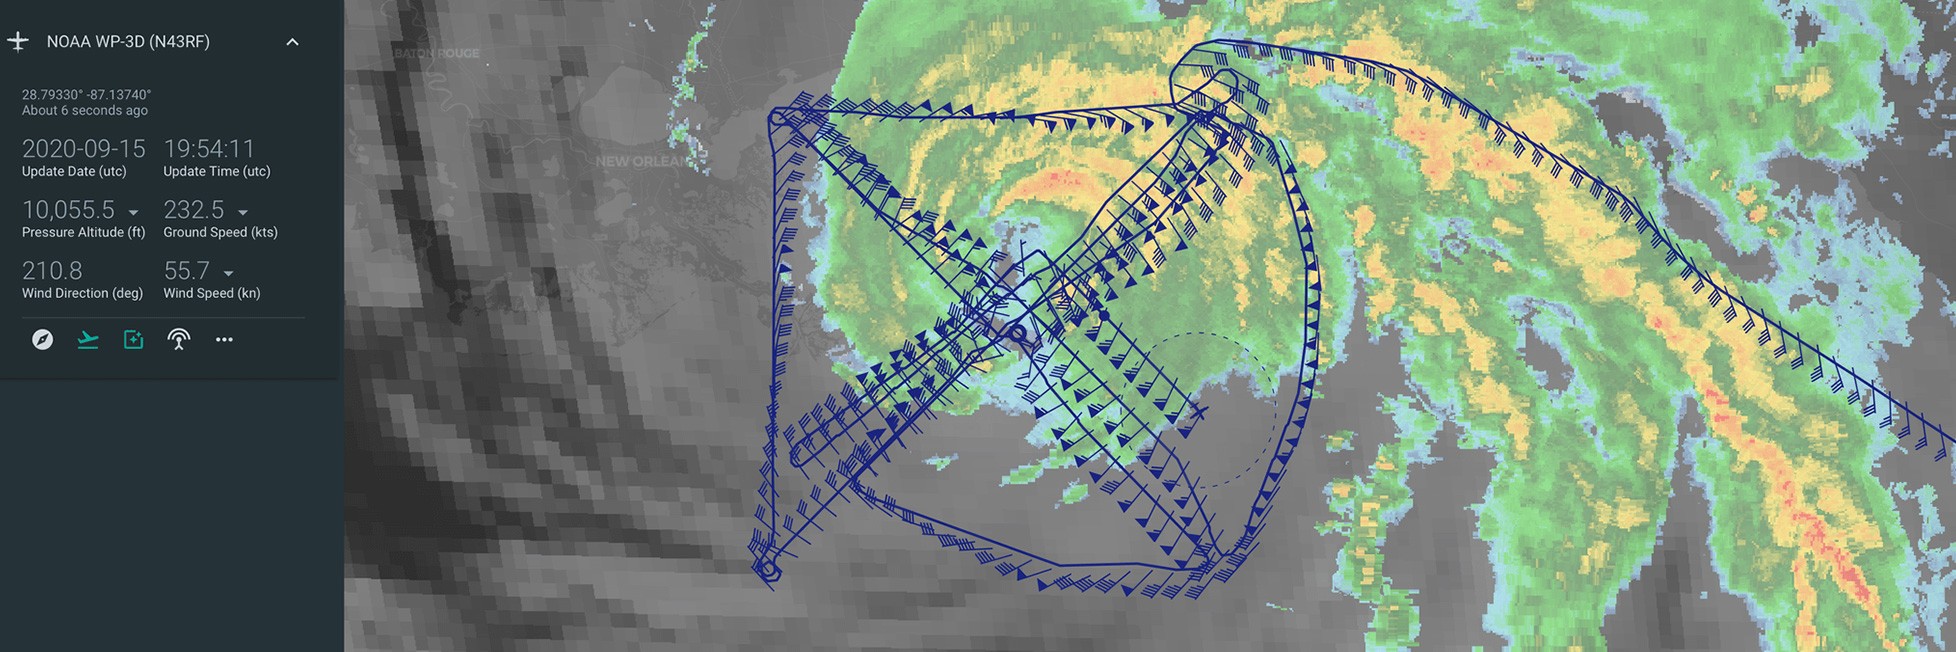
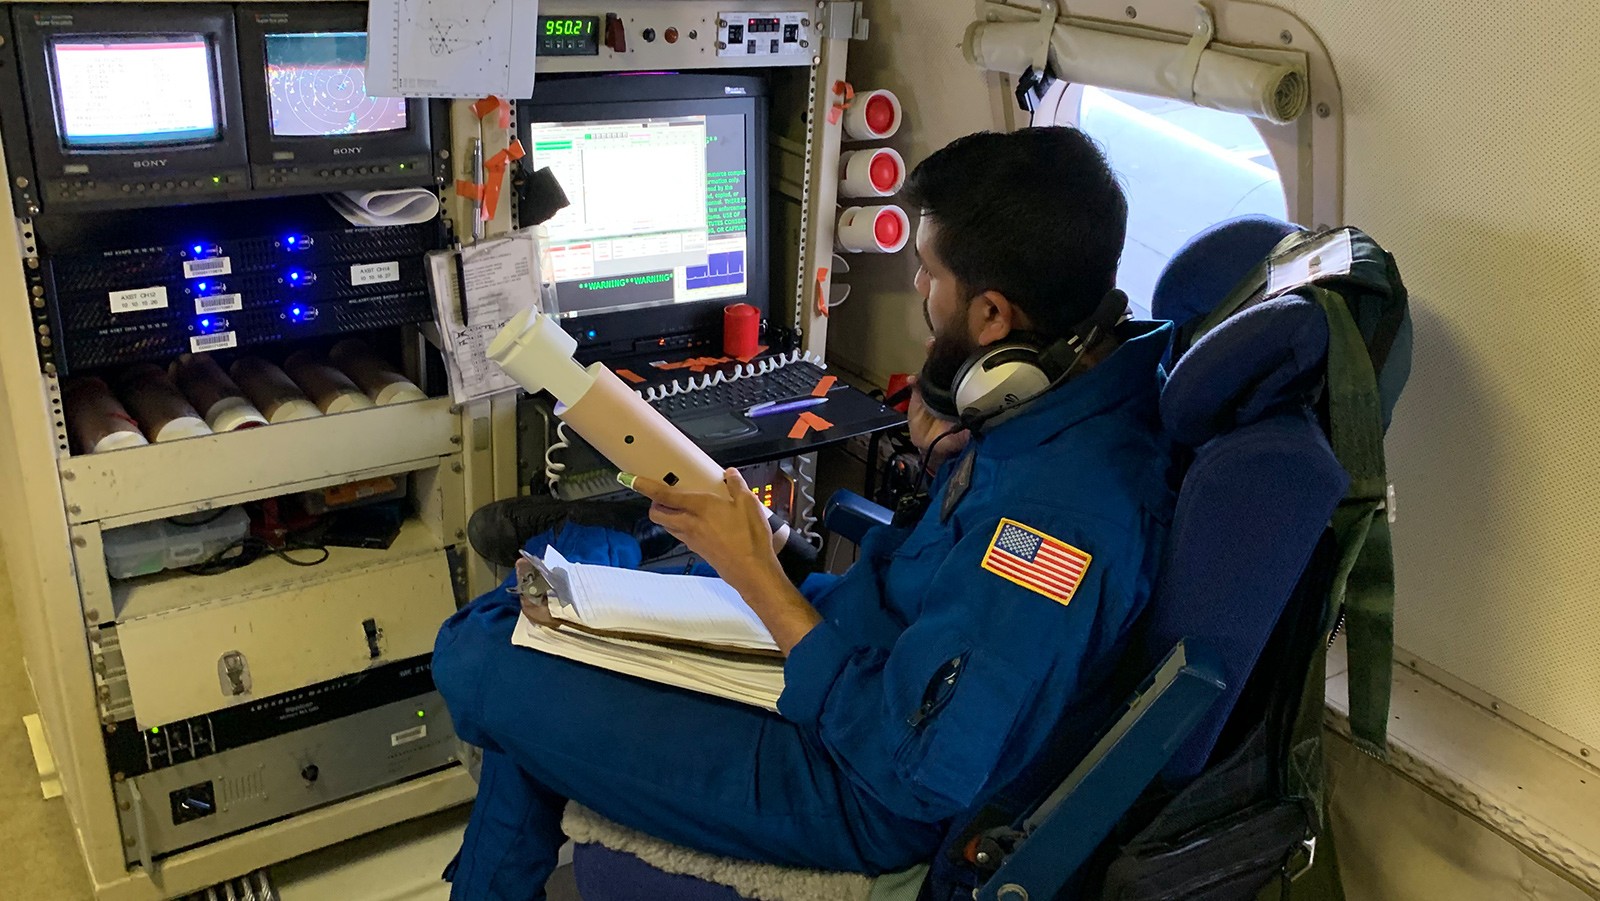
Dropsondes
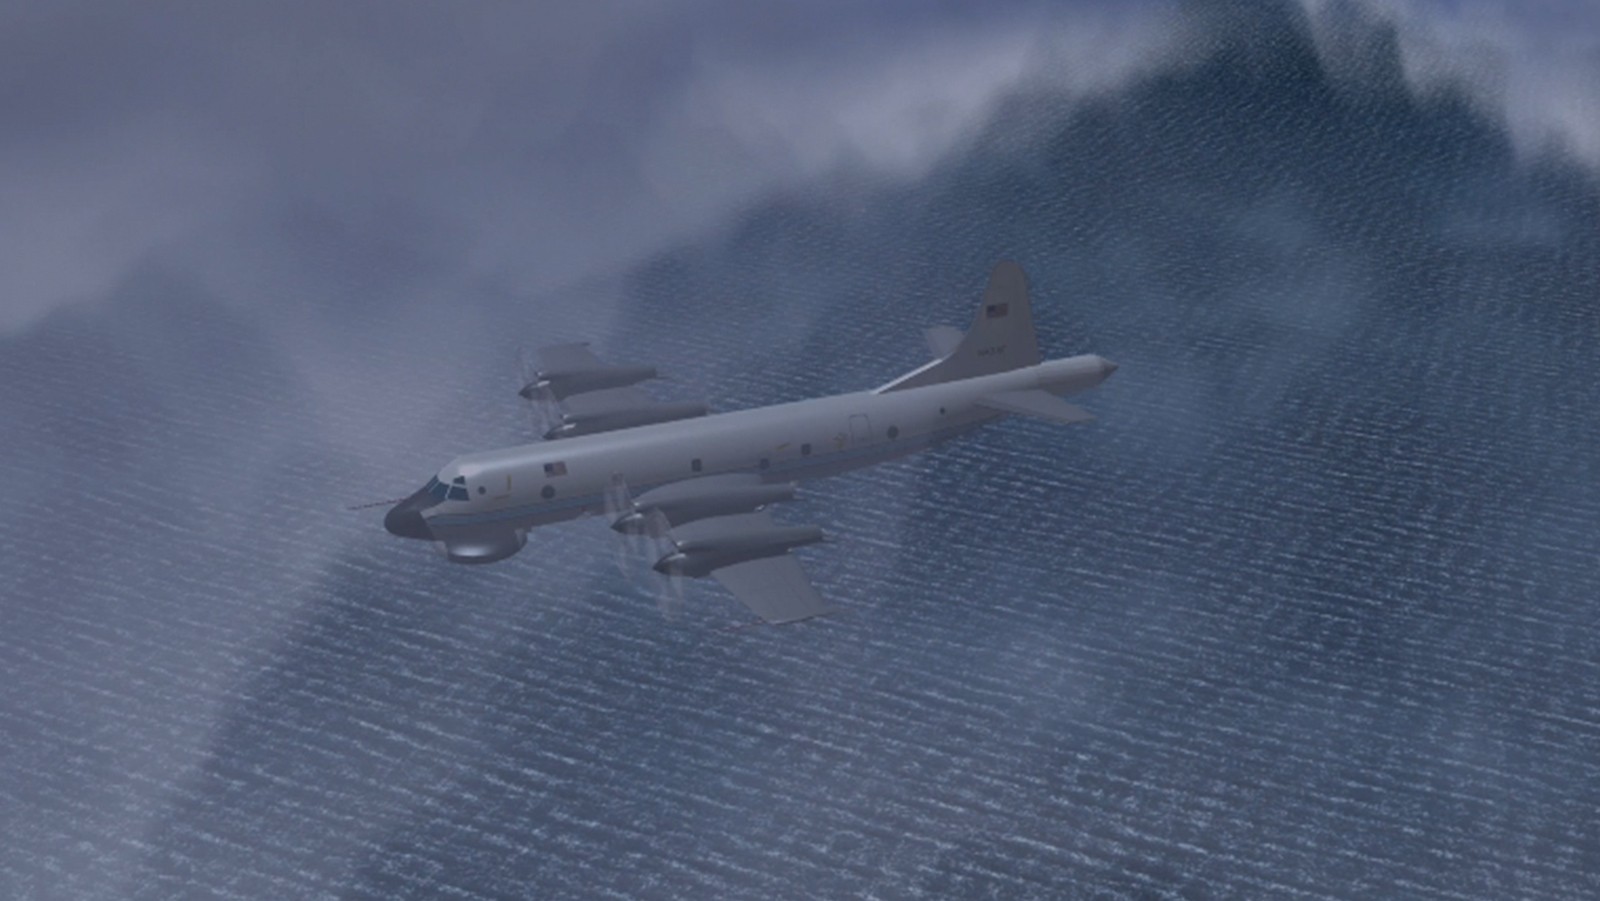
Dropsondes Measure Important Atmospheric Conditions
As our Hurricane Hunter Scientists make passes through the storm, they release small sensor packages on parachutes called dropsondes. These instruments provide measurements of temperature, pressure, humidity and wind as they descend through the storm. See more of our videos on YouTube.
Frequently Asked Questions about Hurricanes
Why Don't Nuclear Weapons Destroy Hurricanes?
The amount of energy that a storm produces far outweighs the energy produced by one nuclear weapon. Additionally, radioactive fallout from such an operation would far outweigh the benefits while not altering the storm.
How Much Energy is Released from a Hurricane?
The energy released from a hurricane can be explained in two ways: the total amount of energy released by the condensation of water droplets (latent heat), or the amount of kinetic energy generated to maintain the strong, swirling winds of a hurricane. The vast majority of the latent heat released is used to drive the convection of a storm, but the total energy released from condensation is 200 times the world-wide electrical generating capacity, or 6.0 x 10¹⁴ watts per day. If you measure the total kinetic energy instead, it comes out to about 1.5 x 10¹² watts per day, or ½ of the world-wide electrical generating capacity. While the latent release of heat feeds a hurricane’s momentum, only a small fraction goes into wind energy. Much more is fed back into the ocean surface as wave energy.
What Causes Tropical Cyclones?
Throughout the tropical atmosphere there is abundant energy that forces convection. However, tropical cyclone formation requires other favorable conditions such as low shear, instability, and mid-level moisture. These variables don’t often coincide, which is why cyclogenesis is fairly rare.
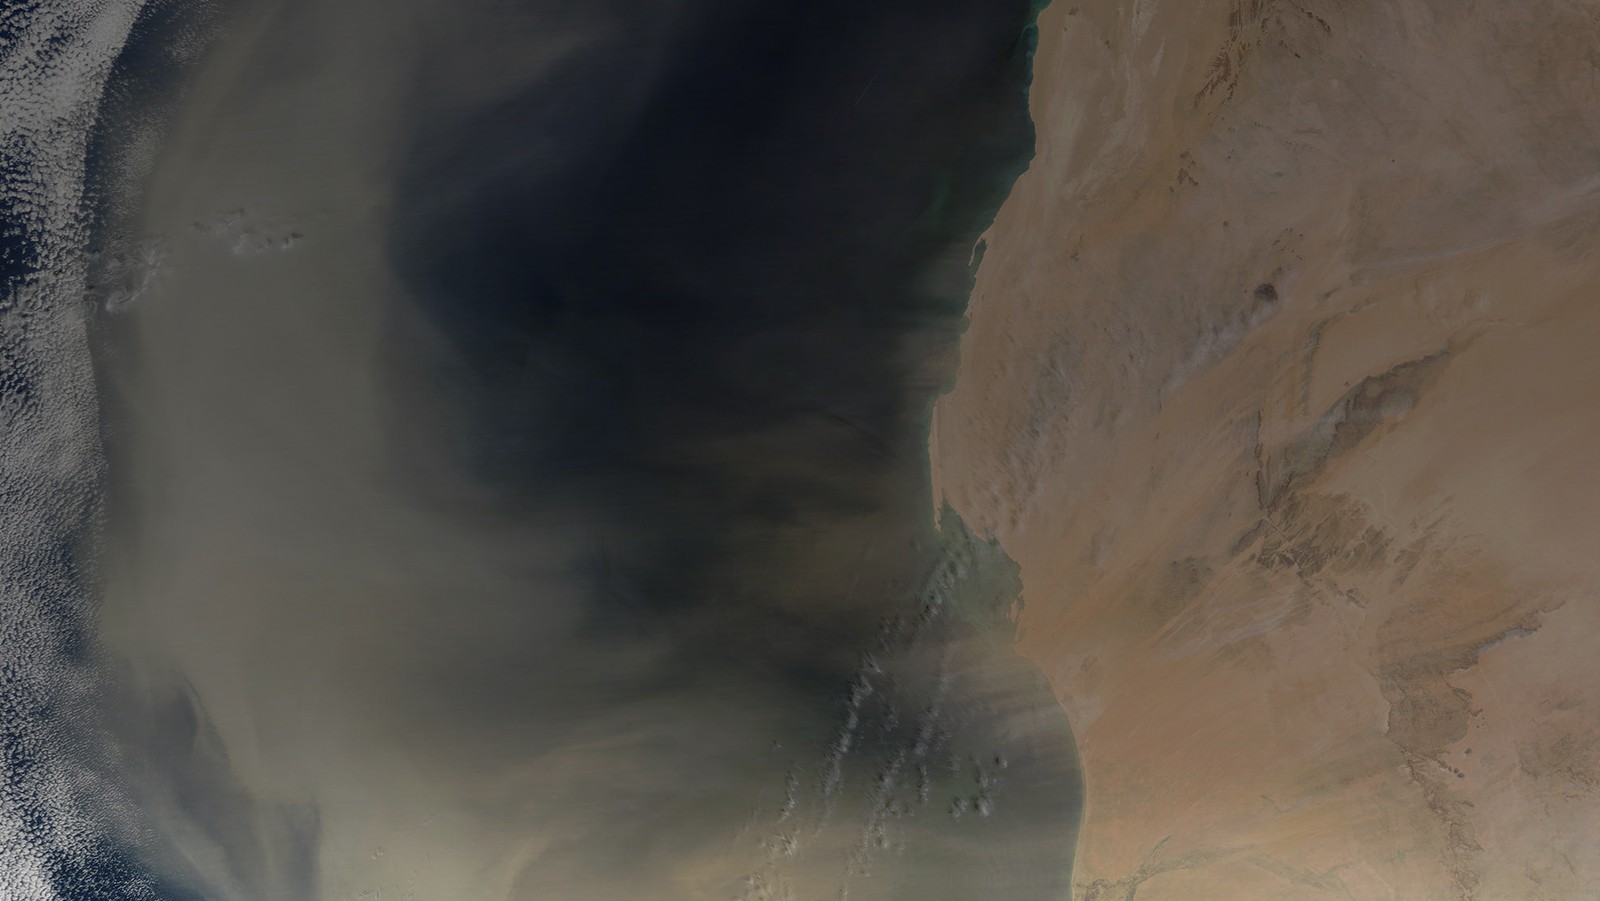
These factors vary with the seasons. In the Atlantic, it is usually in mid-August to mid-October when the subtropical ridge moves northward enough to allow the deep tropical flow to push disturbances off Africa over the warm seas. These African Easterly Waves are pressure fluctuations in the lower troposphere (ocean surface to 3 miles above) that travel from Africa at speeds of about 3mph westward as a result of the African Easterly Jet. About 85% of intense hurricanes and about 60% of smaller storms have their origin in these African Easterly Waves. The rest of them form from old frontal zones over warm water or from subtropical disturbances from the mid-latitudes.
Why are Tropical Cyclones Always Worse on the Right Side?
If a hurricane is moving to the west, the right side would be to the north of the storm, if it is heading north, then the right side would be to the east of the storm. The movement of a hurricane can be broken into two parts- the spiral movement and its forward movement. If the hurricane is moving forward, the side of the spiral with winds parallel and facing forward in the direction of movement will go faster, because you are adding two velocities together. The side of the spiral parallel to the movement, but going in the opposite direction will be slower, because you must subtract the velocity moving away (backwards) from the forward velocity.
For example, a hurricane with 90mph winds moving at 10mph would have a 100mph wind speed on the right (forward-moving) side and 80 mph on the side with the backward motion.
How are Hurricanes Named?
Prior to the late 19th century, hurricane were named after the fact, usually after saints’ feast days or unusual circumstances. In 1896, Clement Wragge, chief of the Queensland Weather Bureau, began using women’s names for tropical cyclones near Australia. While the practice lapsed for several decades, it was revived by Army Air Force meteorologists during World War II. The US Weather Bureau adopted woman’s name lists officially in 1953 for Atlantic hurricanes. In 1979, the lists were modified, alternating men and women’s names.
Today, name lists are maintained by the United Nations World Meteorological Organization for multiple oceanic basins. Most lists rotate every few years. In the Atlantic, it rotates every six years.
Reddit AMA
With Hurricane Hunters Dr. Frank Marks & Commander Justin Kibbey
Contact

⨕ Ghassan “Gus” Alaka, Ph.D ⨕
Director, Hurricane Research Division
