
Global Drifter Program
Cornerstone of the Global Ocean Observing System
JUMP TO DATA OR SCROLL TO LEARN MORE
Who We Are
What We Do
The Global Drifter Program is a branch of NOAA’s Global Ocean Observing System and a scientific project of the Data Buoy Cooperation Panel. It has two components: the Global Drifter Center at AOML and the Lagrangian Drifter Laboratory (LDL) at Scripps Institution of Oceanography, UC San Diego. The LDL supervises drifter production, designs and tests new types of drifters, and manages the real-time data flow on the Global Telecommunications System.
Objectives of the Global Drifter Center
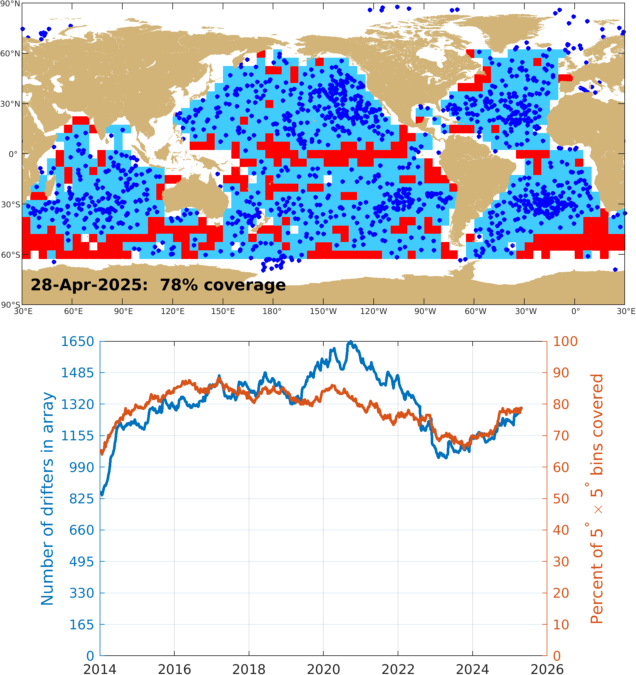
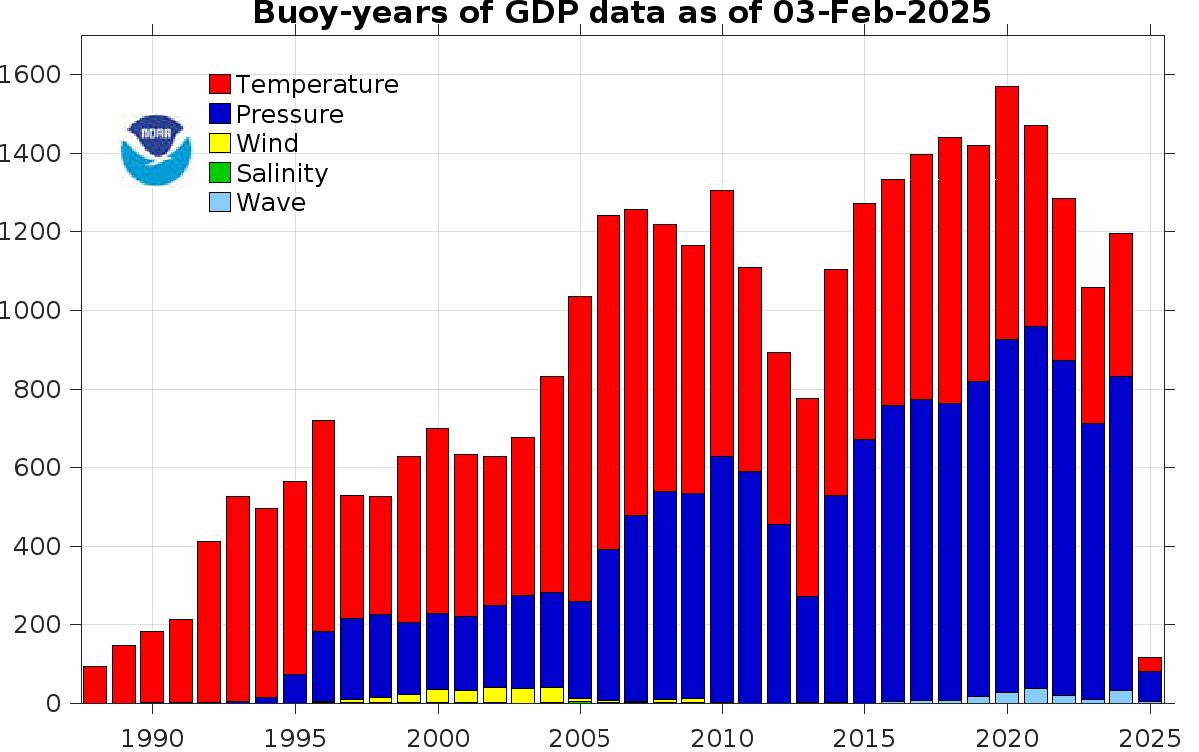
- Maintain a global 5° x 5° gridded array of ~1,300 satellite-tracked surface drifting buoys to meet the need for an accurate and globally dense set of in-situ observations of mixed layer currents, sea surface temperature, atmospheric pressure, winds, waves, and salinity.
- Provide a data processing system for the use of these data.


Top News
Adopt a Drifter Program grows this summer
July 7, 2026
More than 20 years after the first teacher adopted a drifter, NOAA’s Adopt a Drifter Program , co-led by the Global Ocean Monitoring and Observing Program (GOMO) and the Atlantic Oceanographic and Meteorological Laboratory (AOML), continues to grow and evolve this summer.


Read More News
Drifters Provide Critical Data to Improve Forecasts
Background
Recognizing the Need for a Global Ocean Observing System
As weather forecasters developed numerical models to predict weather in the 1950s and 1960s, they realized that the greatest limitation to improving forecast accuracy was not computer power, but the scarcity of observations. Land stations measure air pressure over land and transmit the observations to the forecasters, but over 70% of the earth’s surface is covered by oceans. To address this, NOAA’s Global Drifter Program (GDP) maintains an array of over 1,000 drifting buoys that measure air pressure over the ocean and send these data to satellites passing overhead, which then transmit the data within an hour to the forecasters. Drifters are deployed by national and international partners of the GDP, coordinated by the GDP’s Drifter Operations Center at AOML. The data are then processed and quality controlled at the GDP’s Data Assembly Center, also located at AOML.


The program manages the collection, analysis, and distribution of the data acquired by these drifters. The program reached its goal of 1250 operational drifters on September 18th, 2005 and has maintained these drifters since. It was the first component of the Global Ocean Observing System to reach completion.
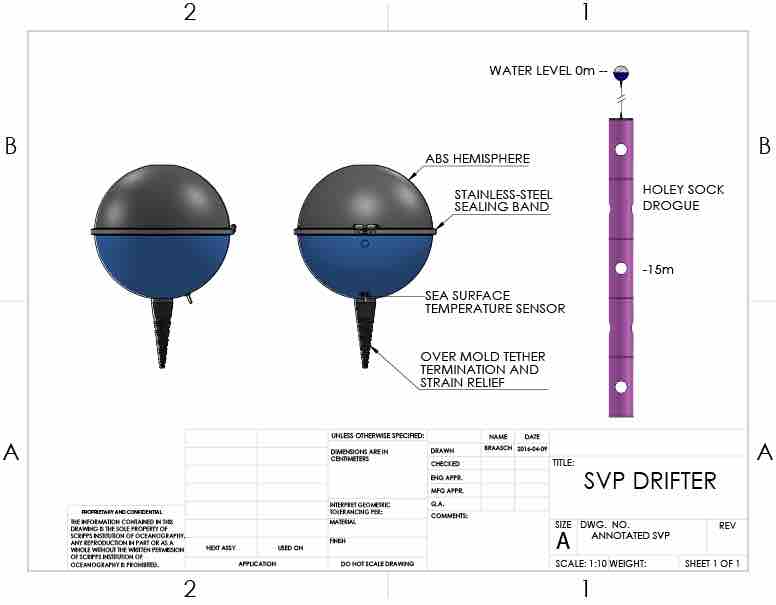
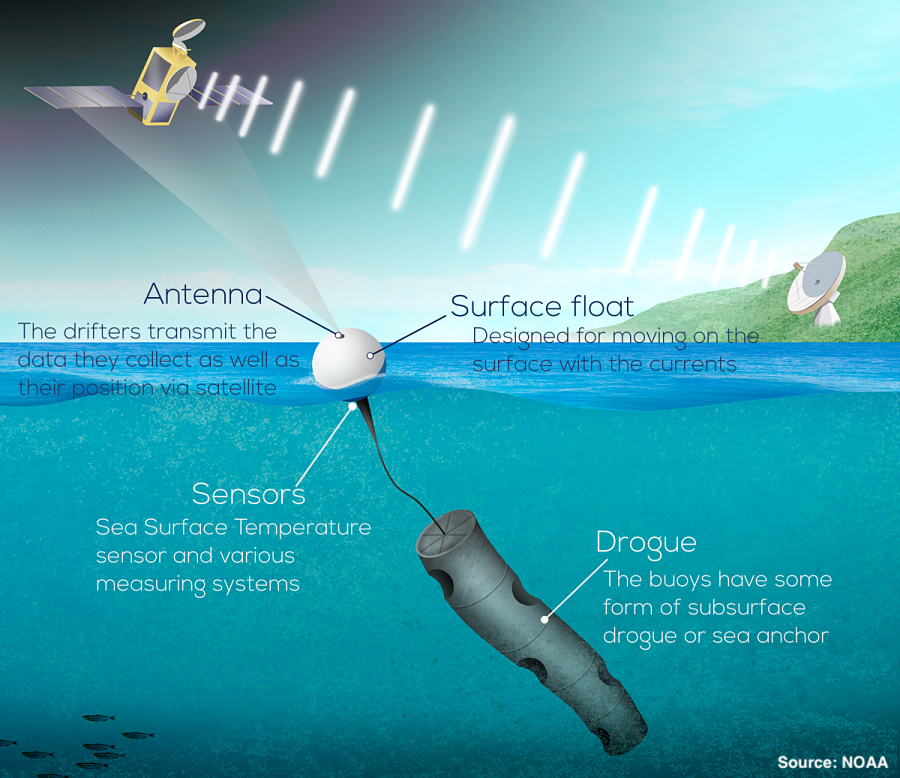
Components of a Drifter
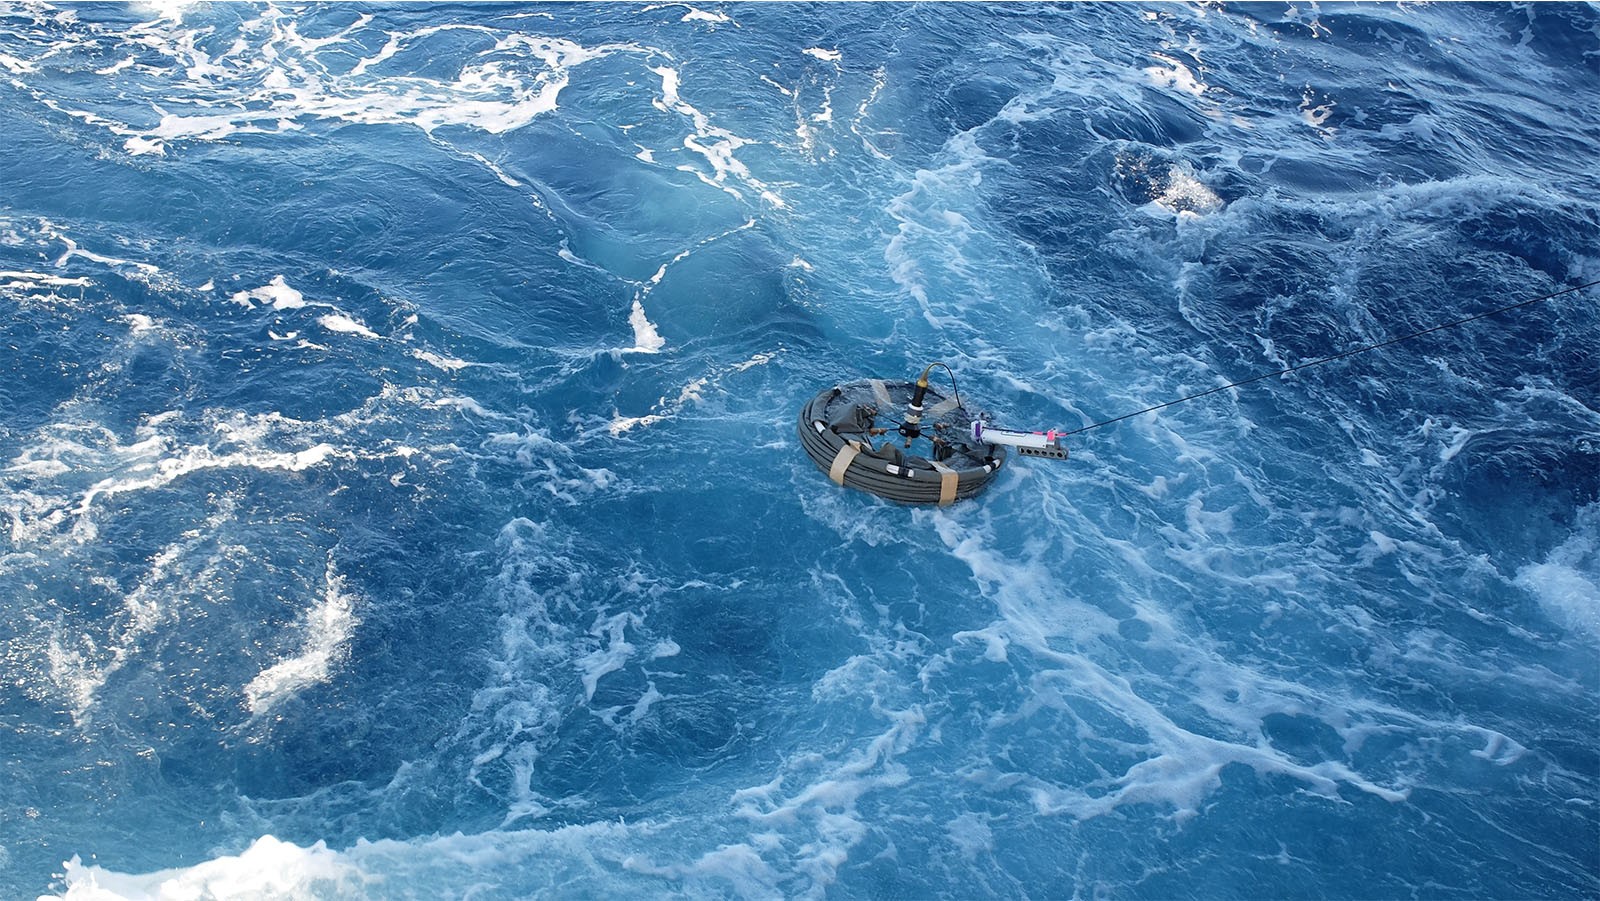
All drifters measure sea surface temperature, but most are also equipped to measure other variables. As the drifter moves around, guided by ocean currents, measurements of atmospheric pressure, winds, wave height, and salinity can be taken. This data is collected by sensors in the drifter and transmitted to overhead satellites. Tracking the location of drifters over time allows scientists to build a profile of ocean currents.
A drifter’s drogue, also known as a sea anchor, extends 20 meters (or 65 feet) deep and is designed to move with the near-surface ocean currents. The drogue and surface float move together, connected by a long tether. Without a drogue, the drifter will be transported by wind and waves, much as a ping pong ball or beach ball is pushed across the surface of a pool.
ERDDAP Resources
The Global Drifter Program at AOML has an ERDDAP, or Environmental Research Division Data Access Program, server that is now publicly available and hosts both hourly and 6-hour quality-controlled interpolated drifter datasets. This scientific data server uses free and open-source software created by the Environmental Research Division of NOAA’s Southwest Fisheries Science Center.
With the growing importance for strong data management principles, An Overview of the Global Drifter Program’s ERDDAP Server: From Set-up to Metrics’ seminar detailing the benefits of the Global Drifter Program’s ERDDAP server is available on Youtube. For those interested in establishing an ERDDAP server, reference the presentation for great insight, links, and additional resources!
- GDP 6 Hour Drifter Quality Control Dataset
- 6-Hour Drifter data product exists from 1979 to present, well suited for observing larger-scale oceanic processes.
Click here for more information.
- 6-Hour Drifter data product exists from 1979 to present, well suited for observing larger-scale oceanic processes.
- GDP 1 Hour Drifter Quality Control Dataset
- Hourly Drifter data product exists from early 2000’s to present, well suited for observing smaller-scale oceanic processes.
Click here for more information.
- Hourly Drifter data product exists from early 2000’s to present, well suited for observing smaller-scale oceanic processes.
- GDP Climatology Annual Means Dataset
- Annual Means of Drifter data.
Click here for more information.
- Annual Means of Drifter data.
- GDP Climatology Monthly Means Dataset
- Monthly Means of Drifter data. Please note, this dataset does not include the variable N, or number of drifter-days per square degree. To retrieve the variable N, use the variable N in the Climatology – Annual Means dataset.
Click here for more information.
- Monthly Means of Drifter data. Please note, this dataset does not include the variable N, or number of drifter-days per square degree. To retrieve the variable N, use the variable N in the Climatology – Annual Means dataset.
- GDP Climatology Current Variance Dataset
- Current variance (eddy kinetic energy) derived from residuals with respect to the time-mean, seasonal, spatial gradient, and SOI-related currents.
Click here for more information.
- Current variance (eddy kinetic energy) derived from residuals with respect to the time-mean, seasonal, spatial gradient, and SOI-related currents.
- GDP Looper Trajectory Dataset
- Derived from drifting buoy data containing looper trajectory segments.
Click here for more information.
- Derived from drifting buoy data containing looper trajectory segments.
- GDP Nonlooper Trajectory Dataset
- Derived from drifting buoy data containing nonlooper trajectory segments.
Click here for more information.
- Derived from drifting buoy data containing nonlooper trajectory segments.
- OSMC Real-Time Drifter Dataset
- Archive of real-time GTS data from Observing System Monitoring Center (OSMC).
Click here for more information.
- Archive of real-time GTS data from Observing System Monitoring Center (OSMC).
- Subsurface Float Dataset – Compiled by WHOI
- The float observations are collected by acoustically tracked, neutrally-buoyant subsurface floats which collect position data while drifting beneath the ocean surface. Compiled by the World Ocean Circulation Experiment (WOCE) Subsurface Float Data Assembly Center (WFDAC) at the Woods Hole Oceanographic Institution.
Click here for more information.
- The float observations are collected by acoustically tracked, neutrally-buoyant subsurface floats which collect position data while drifting beneath the ocean surface. Compiled by the World Ocean Circulation Experiment (WOCE) Subsurface Float Data Assembly Center (WFDAC) at the Woods Hole Oceanographic Institution.
The Global Drifter Program at AOML plans to add additonal datasets to the ERDDAP™!
The AOML GDP ERDDAP™ belongs to a federation of ERDDAP™ servers. A federated system describes an efficient and decentralized data distribution approach in which multiple ERDDAPs reference a shared dataset, or datasets. Specifically, one ERDDAP™ hosts a dataset, and another ERDDAP™ references the dataset from the host ERDDAP™.
The AOML GDP ERDDAP™ Federation includes our own ERDDAP™, as well as NOAA’s OSMC ERDDAP™ and Ifremer’s Coriolis ERDDAP™.
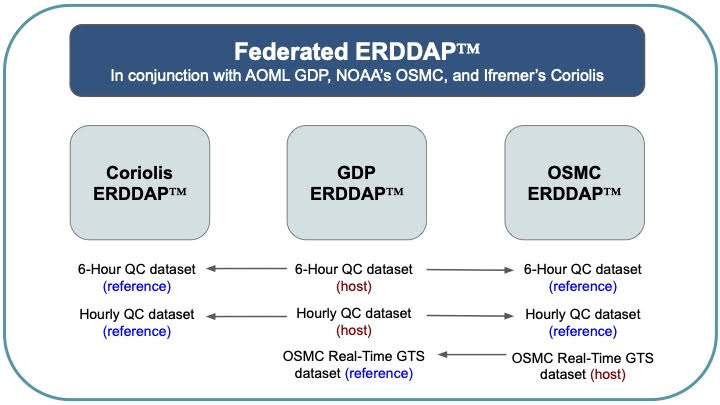
Representation of the AOML GDP Federated ERDDAP™
A federated ERDDAP™ provides multiple benefits to data users and data providers, championing the FAIR data standards! Aside from minimizing data storage costs, a federated ERDDAP™ also eliminates the need to transfer data files from OSMC to the AOML GDP, and from the AOML GDP to Ifremer/Coriolis and to OSMC.
- By redirecting ERDDAP™ data requests to the host ERDDAP™, data requests are timely and efficient.
- Additionally, federated ERDDAPs allow for dataset version control. For example, when the AOML GDP pushes the latest hourly QC update to the ERDDAP™, the referenced dataset on Ifremer’s ERDDAP™ and OSMC’s ERDDAP™ is automatically updated.
- Since ERDDAP™ is a web server, data providers can monitor the server’s traffic and extract key metrics about who is using the data. With a federated ERDDAP™, a host ERDDAP™ logs requests made to the server, and any server referencing the host’s data. Thus, allowing all members of the federated system to generate metrics and identify key KPIs for their respective ERDDAP. The AOML has created an ERDDAP™ Dashboard to display key metrics, including historic monthly reports since the ERDDAP’s creation. GDP metrics report also available on the ERDDAP™ Dashboard.
The AOML GDP has created tutorials and step-by-step instructions to guide you through the ERDDAP™ data request process.
See available resources below:
Written Instructions
- OSMC Real-time Data Request Instructions
- OSMC Real-time Advanced Data Request Instructions
- Hourly Interpolated Data Request Instructions
- Hourly Interpolated Data Graphing Instructions
- 6-Hour Interpolated Data Request Instructions
- 6-Hour Interpolated Data Graphing Instructions
- Subsurface Float ERDDAP Instructions
Video Tutorials
- AOML GDP ERDDAP™
 Tutorial

With the growing importance for strong data management principles, there is great demand for estblishing ERDDAP™ servers. For great insight, links, and additional resources, reference Samantha Ouertani’s presentation below:
Interactive Map & Data Visualization
The Global Drifter Program’s (GDP) Drifter Data Assembly Center (DAC) at AOML has launched an interactive map of the global drifter array. This tool features the ability to zoom and scroll, hover the cursor over drifters to get their identification numbers, and click to see data and metadata including deployment information, manufacturer, and drifter type in an ID card that can be viewed as a high-resolution image with an additional click. Visit the tool.


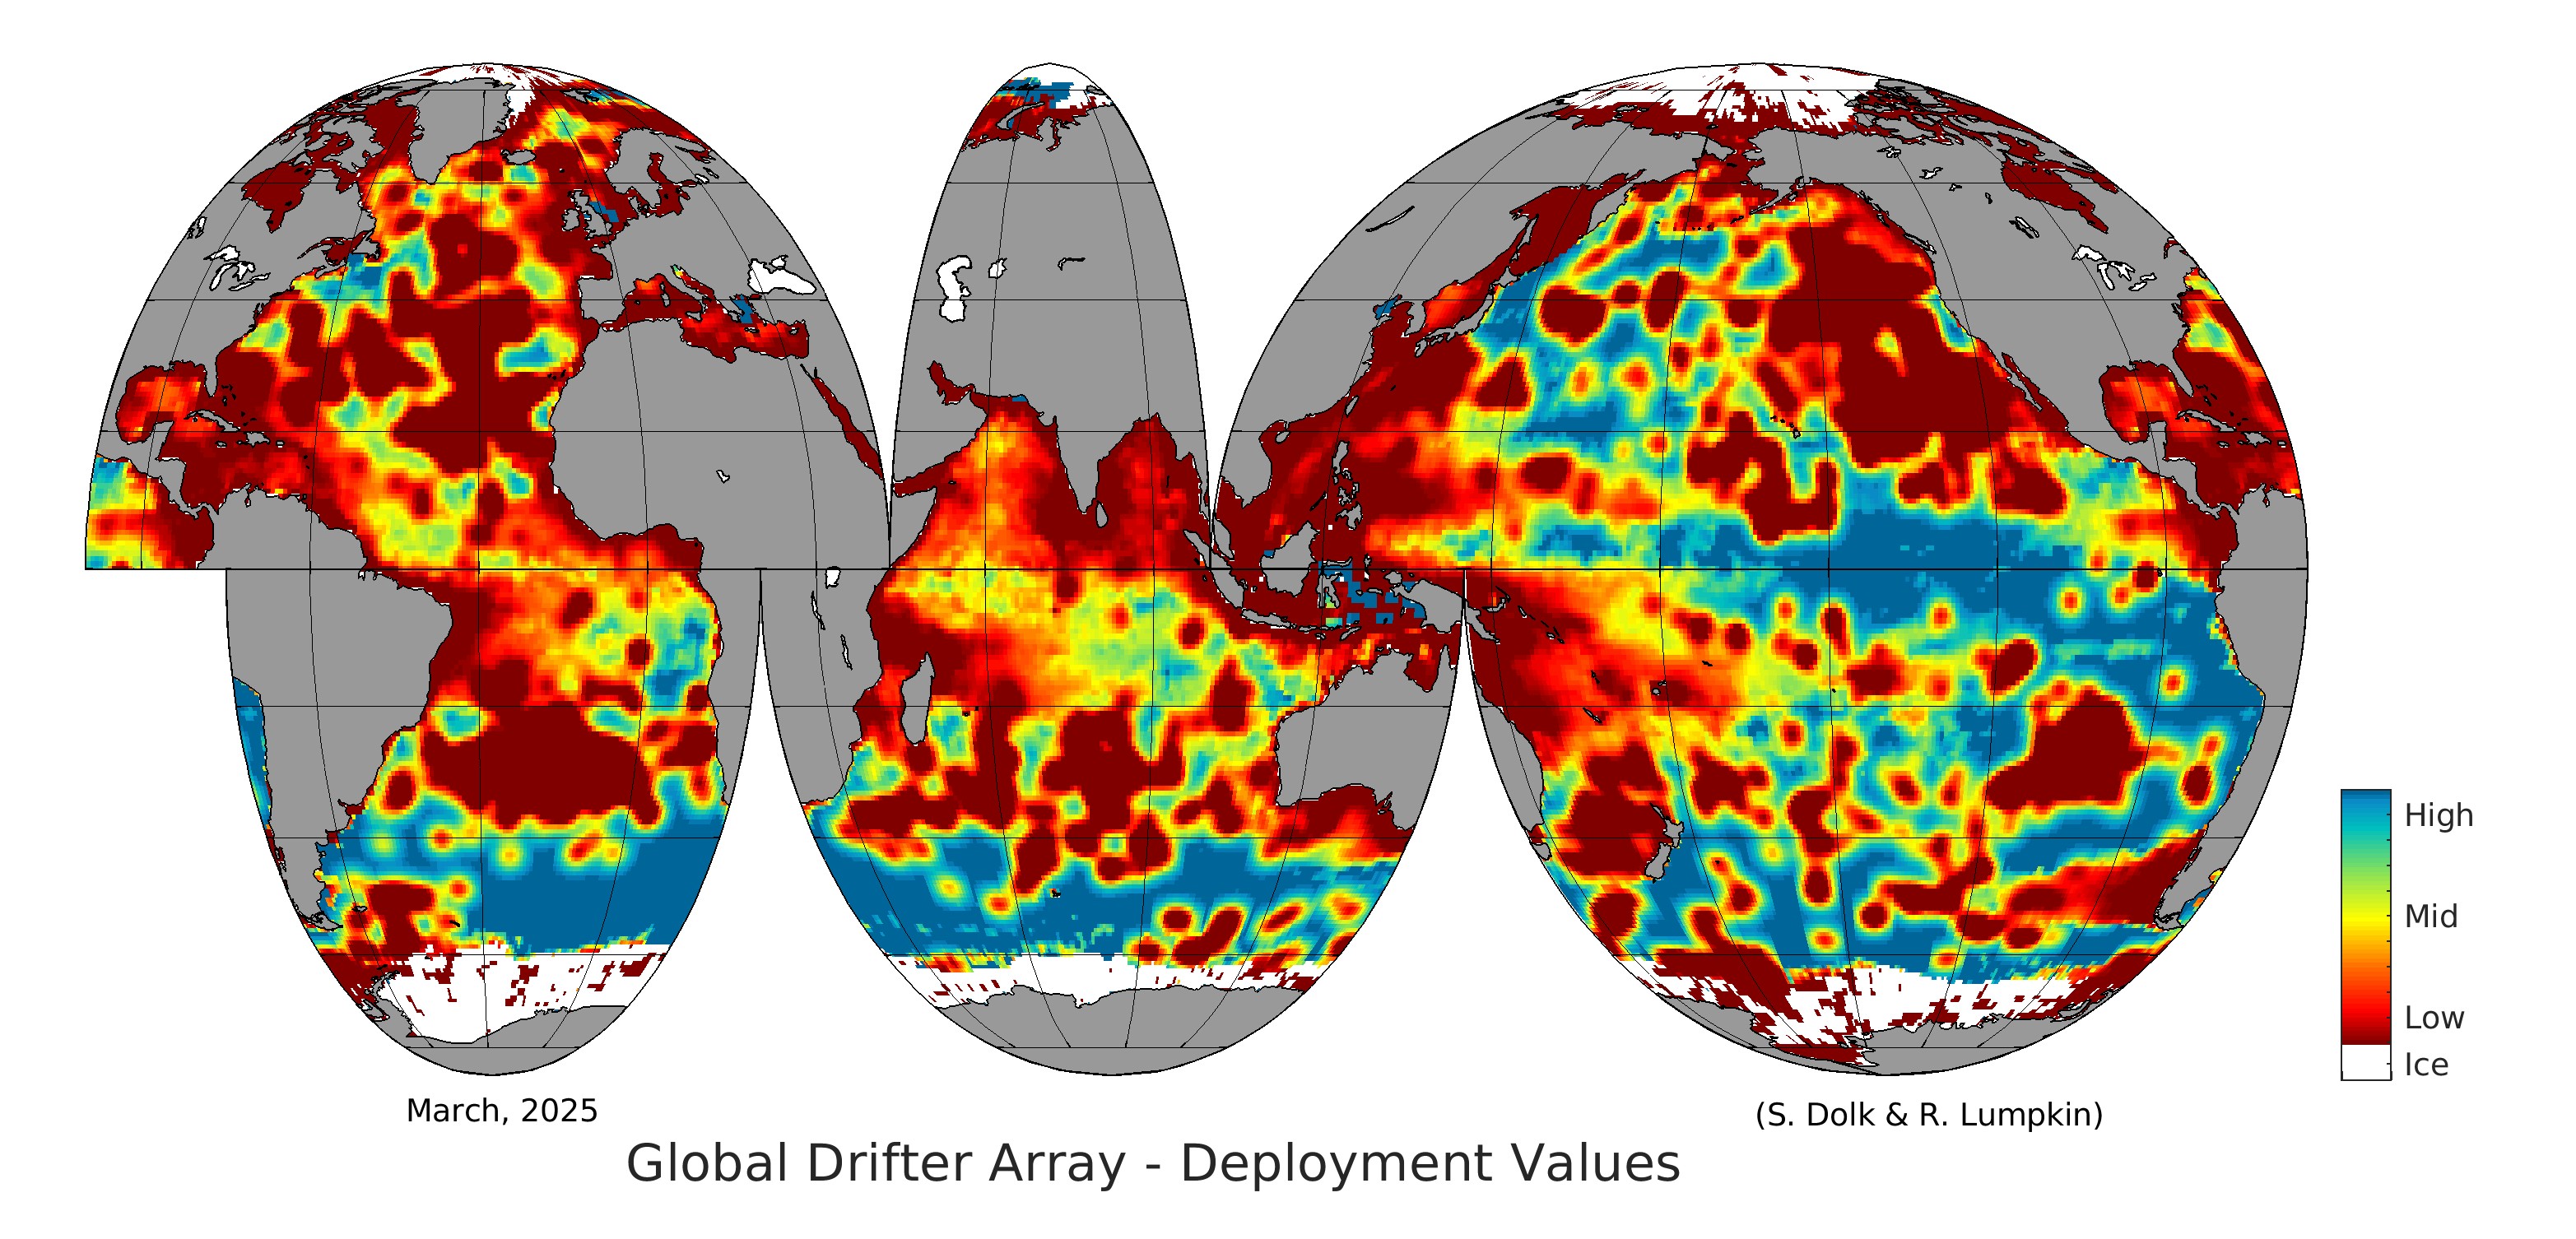
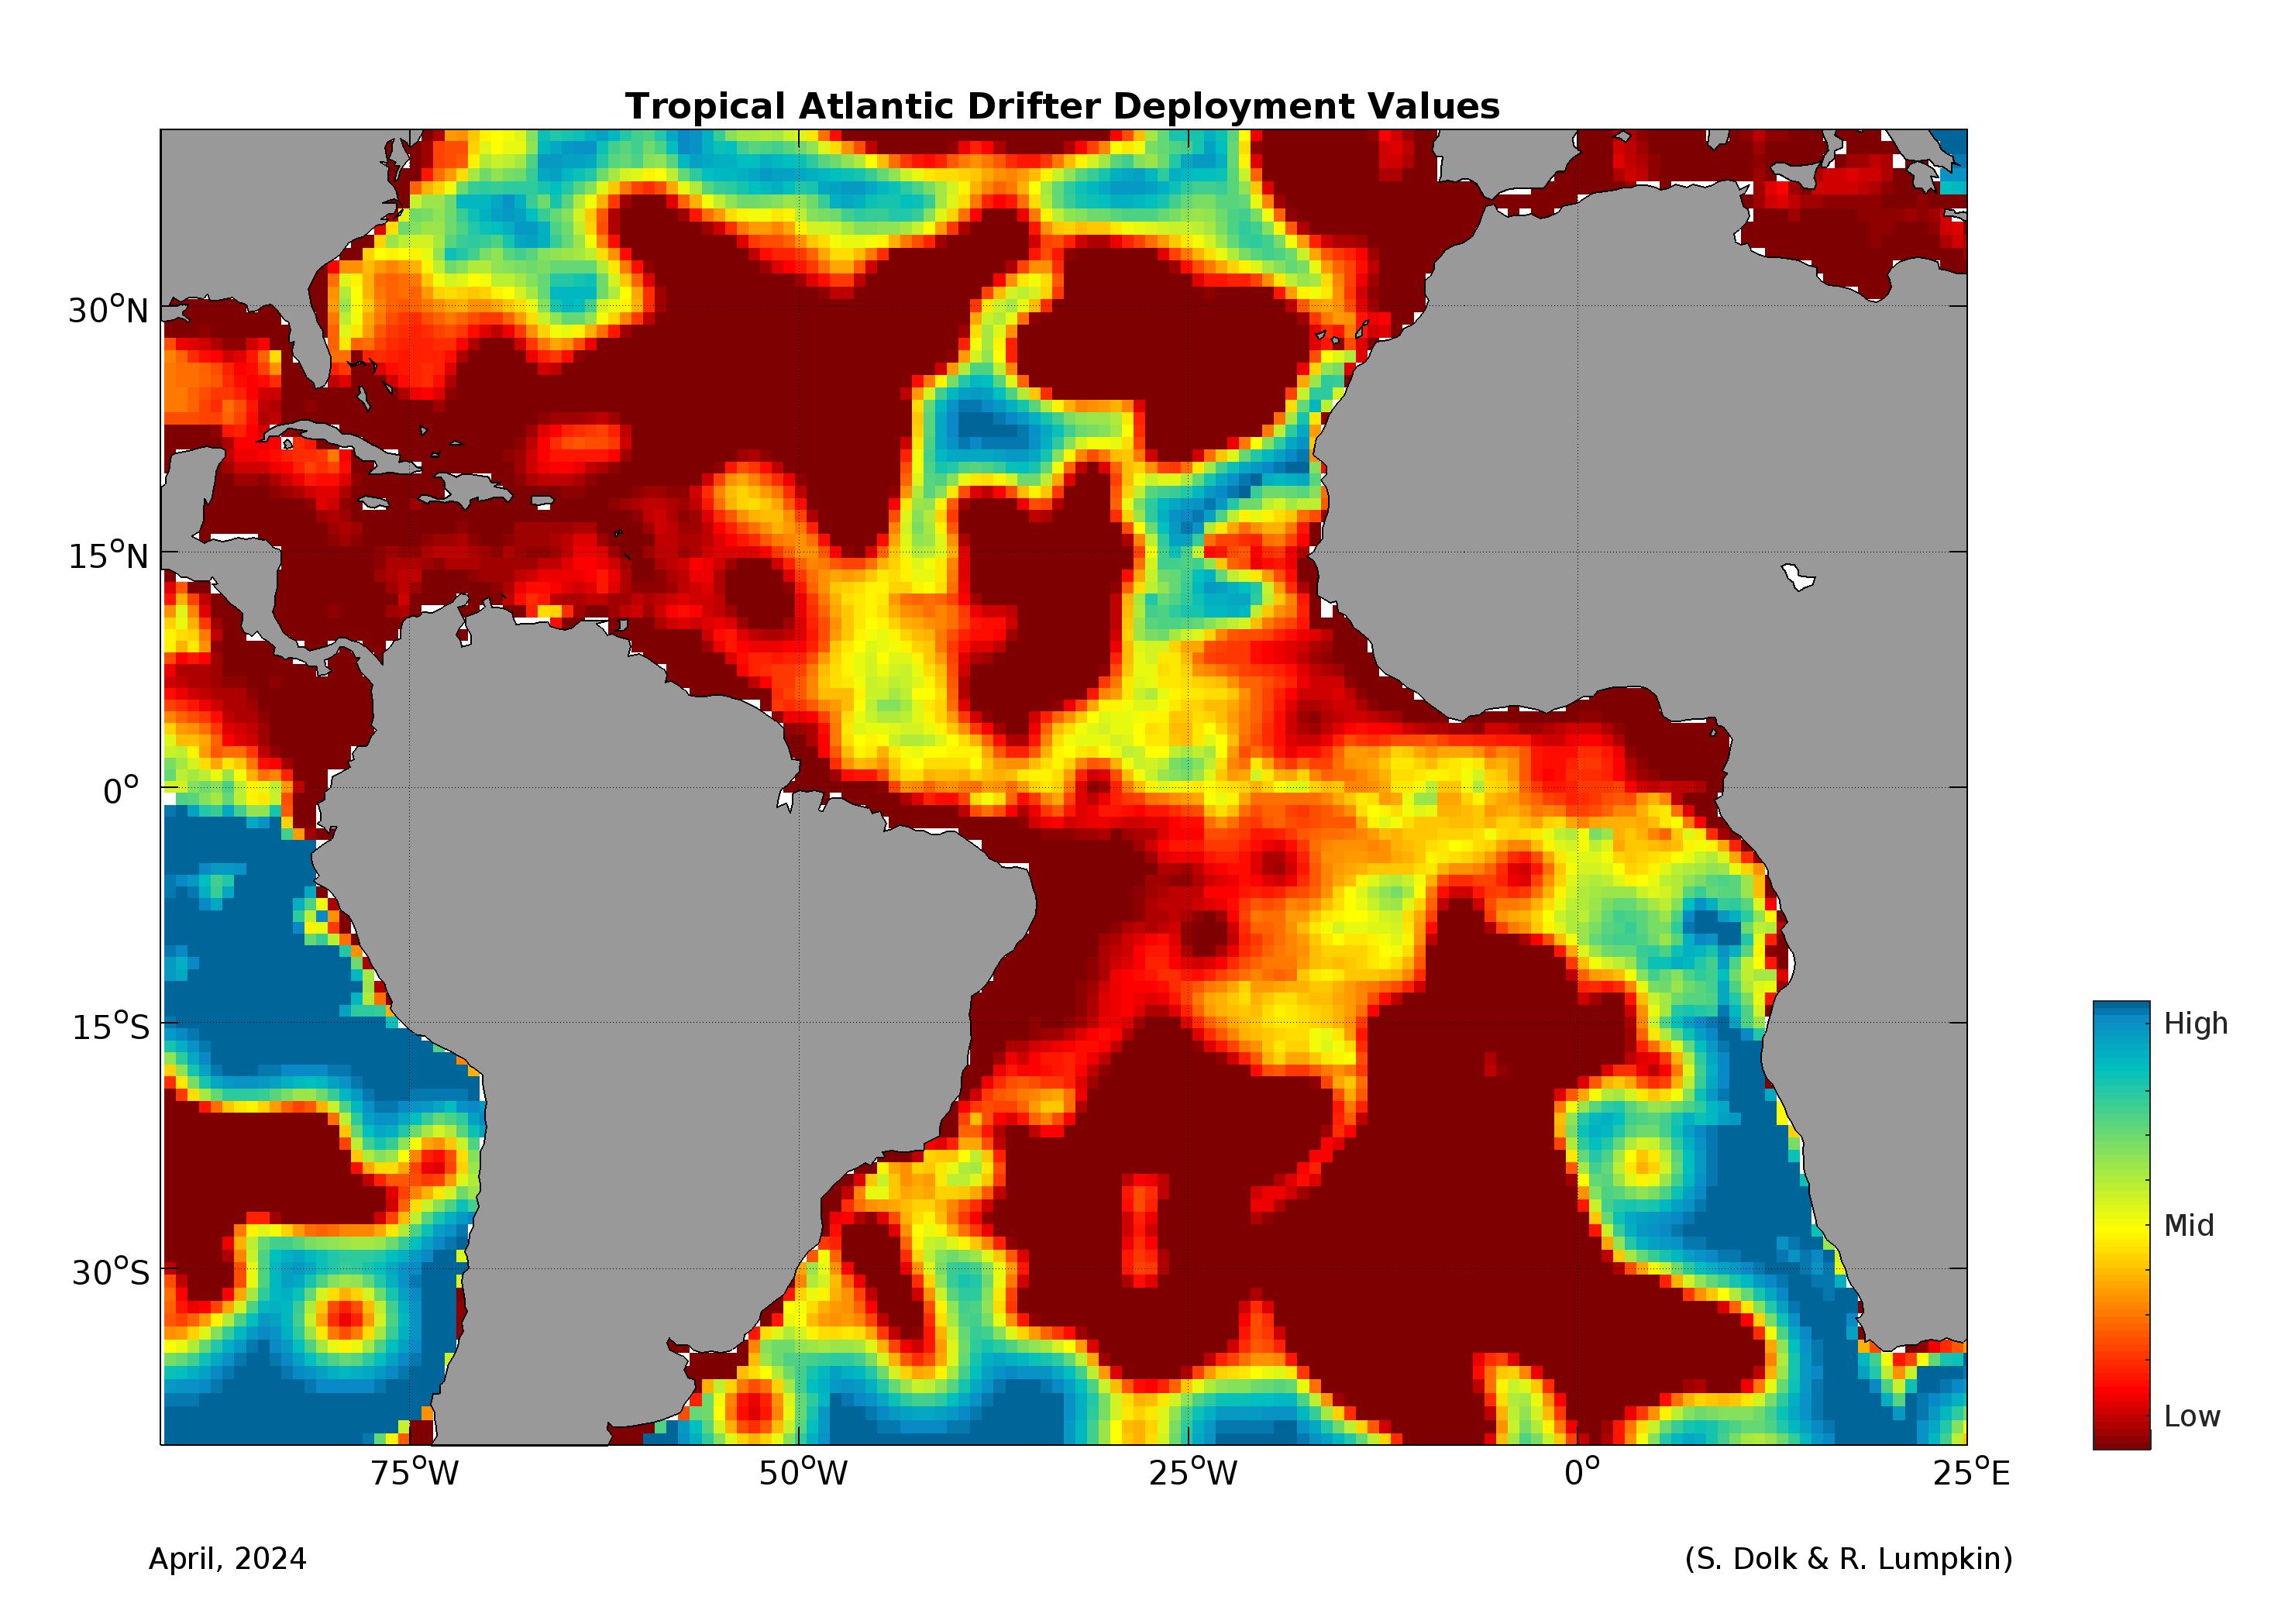
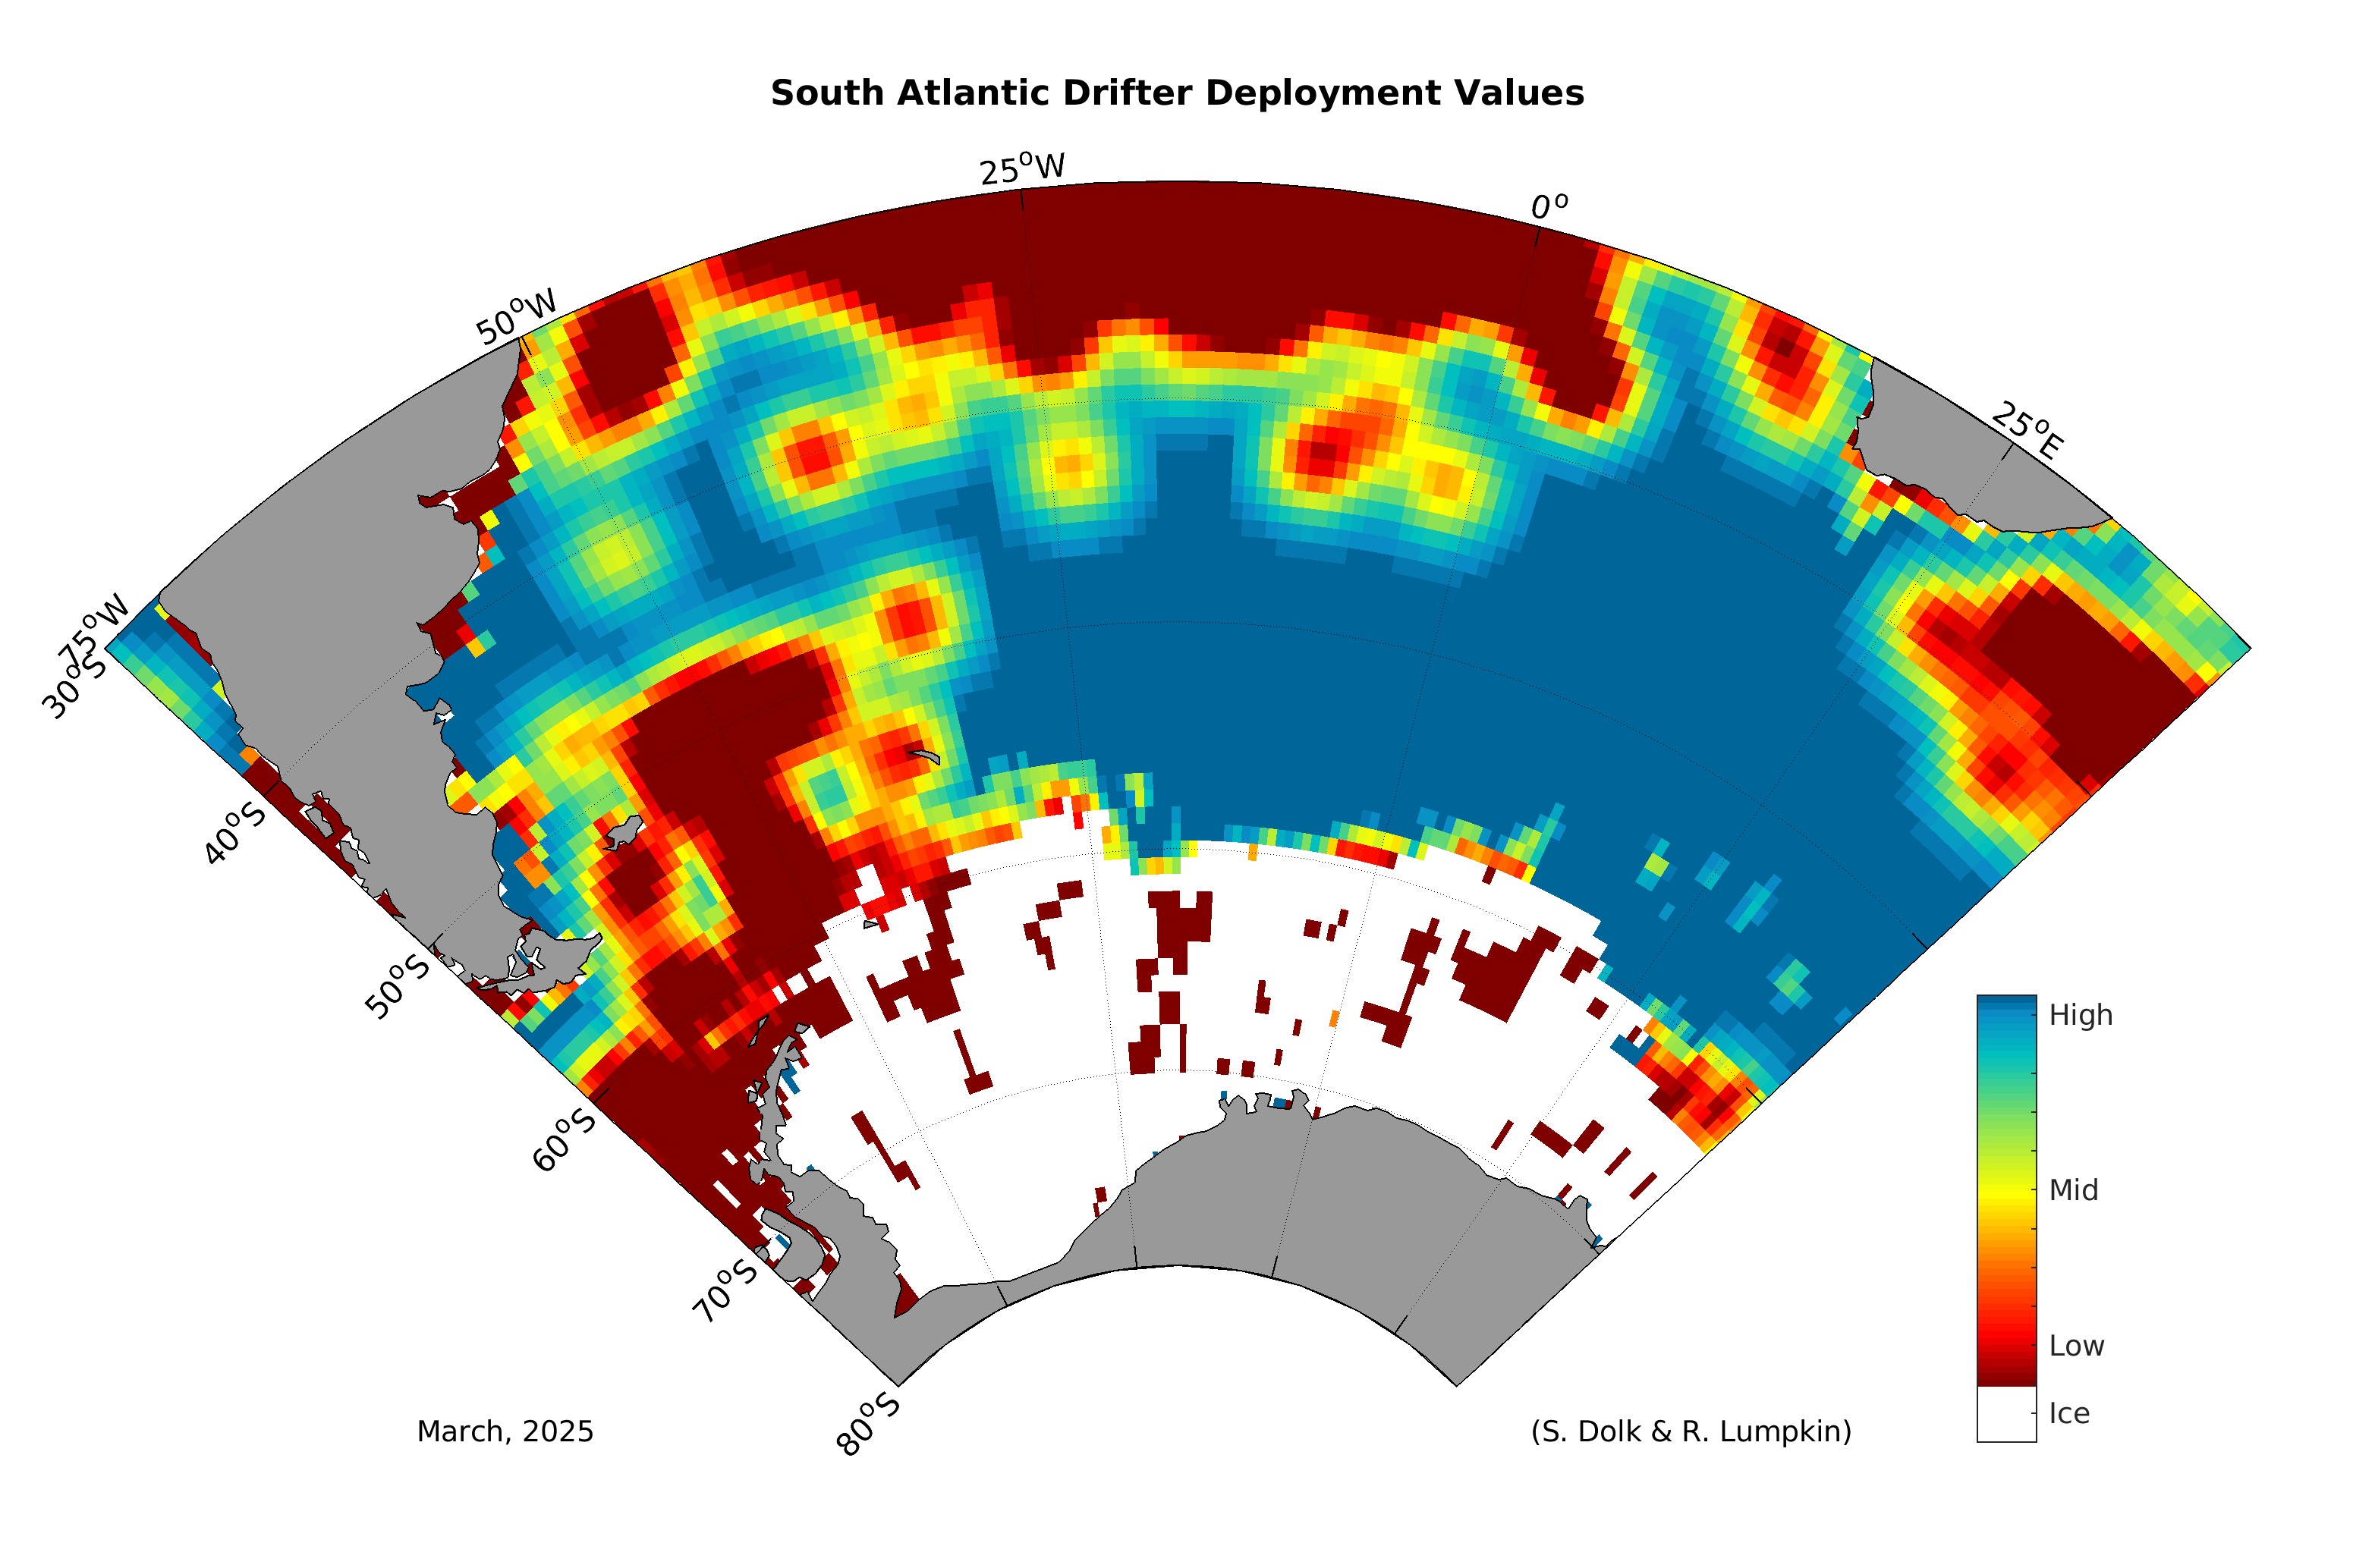
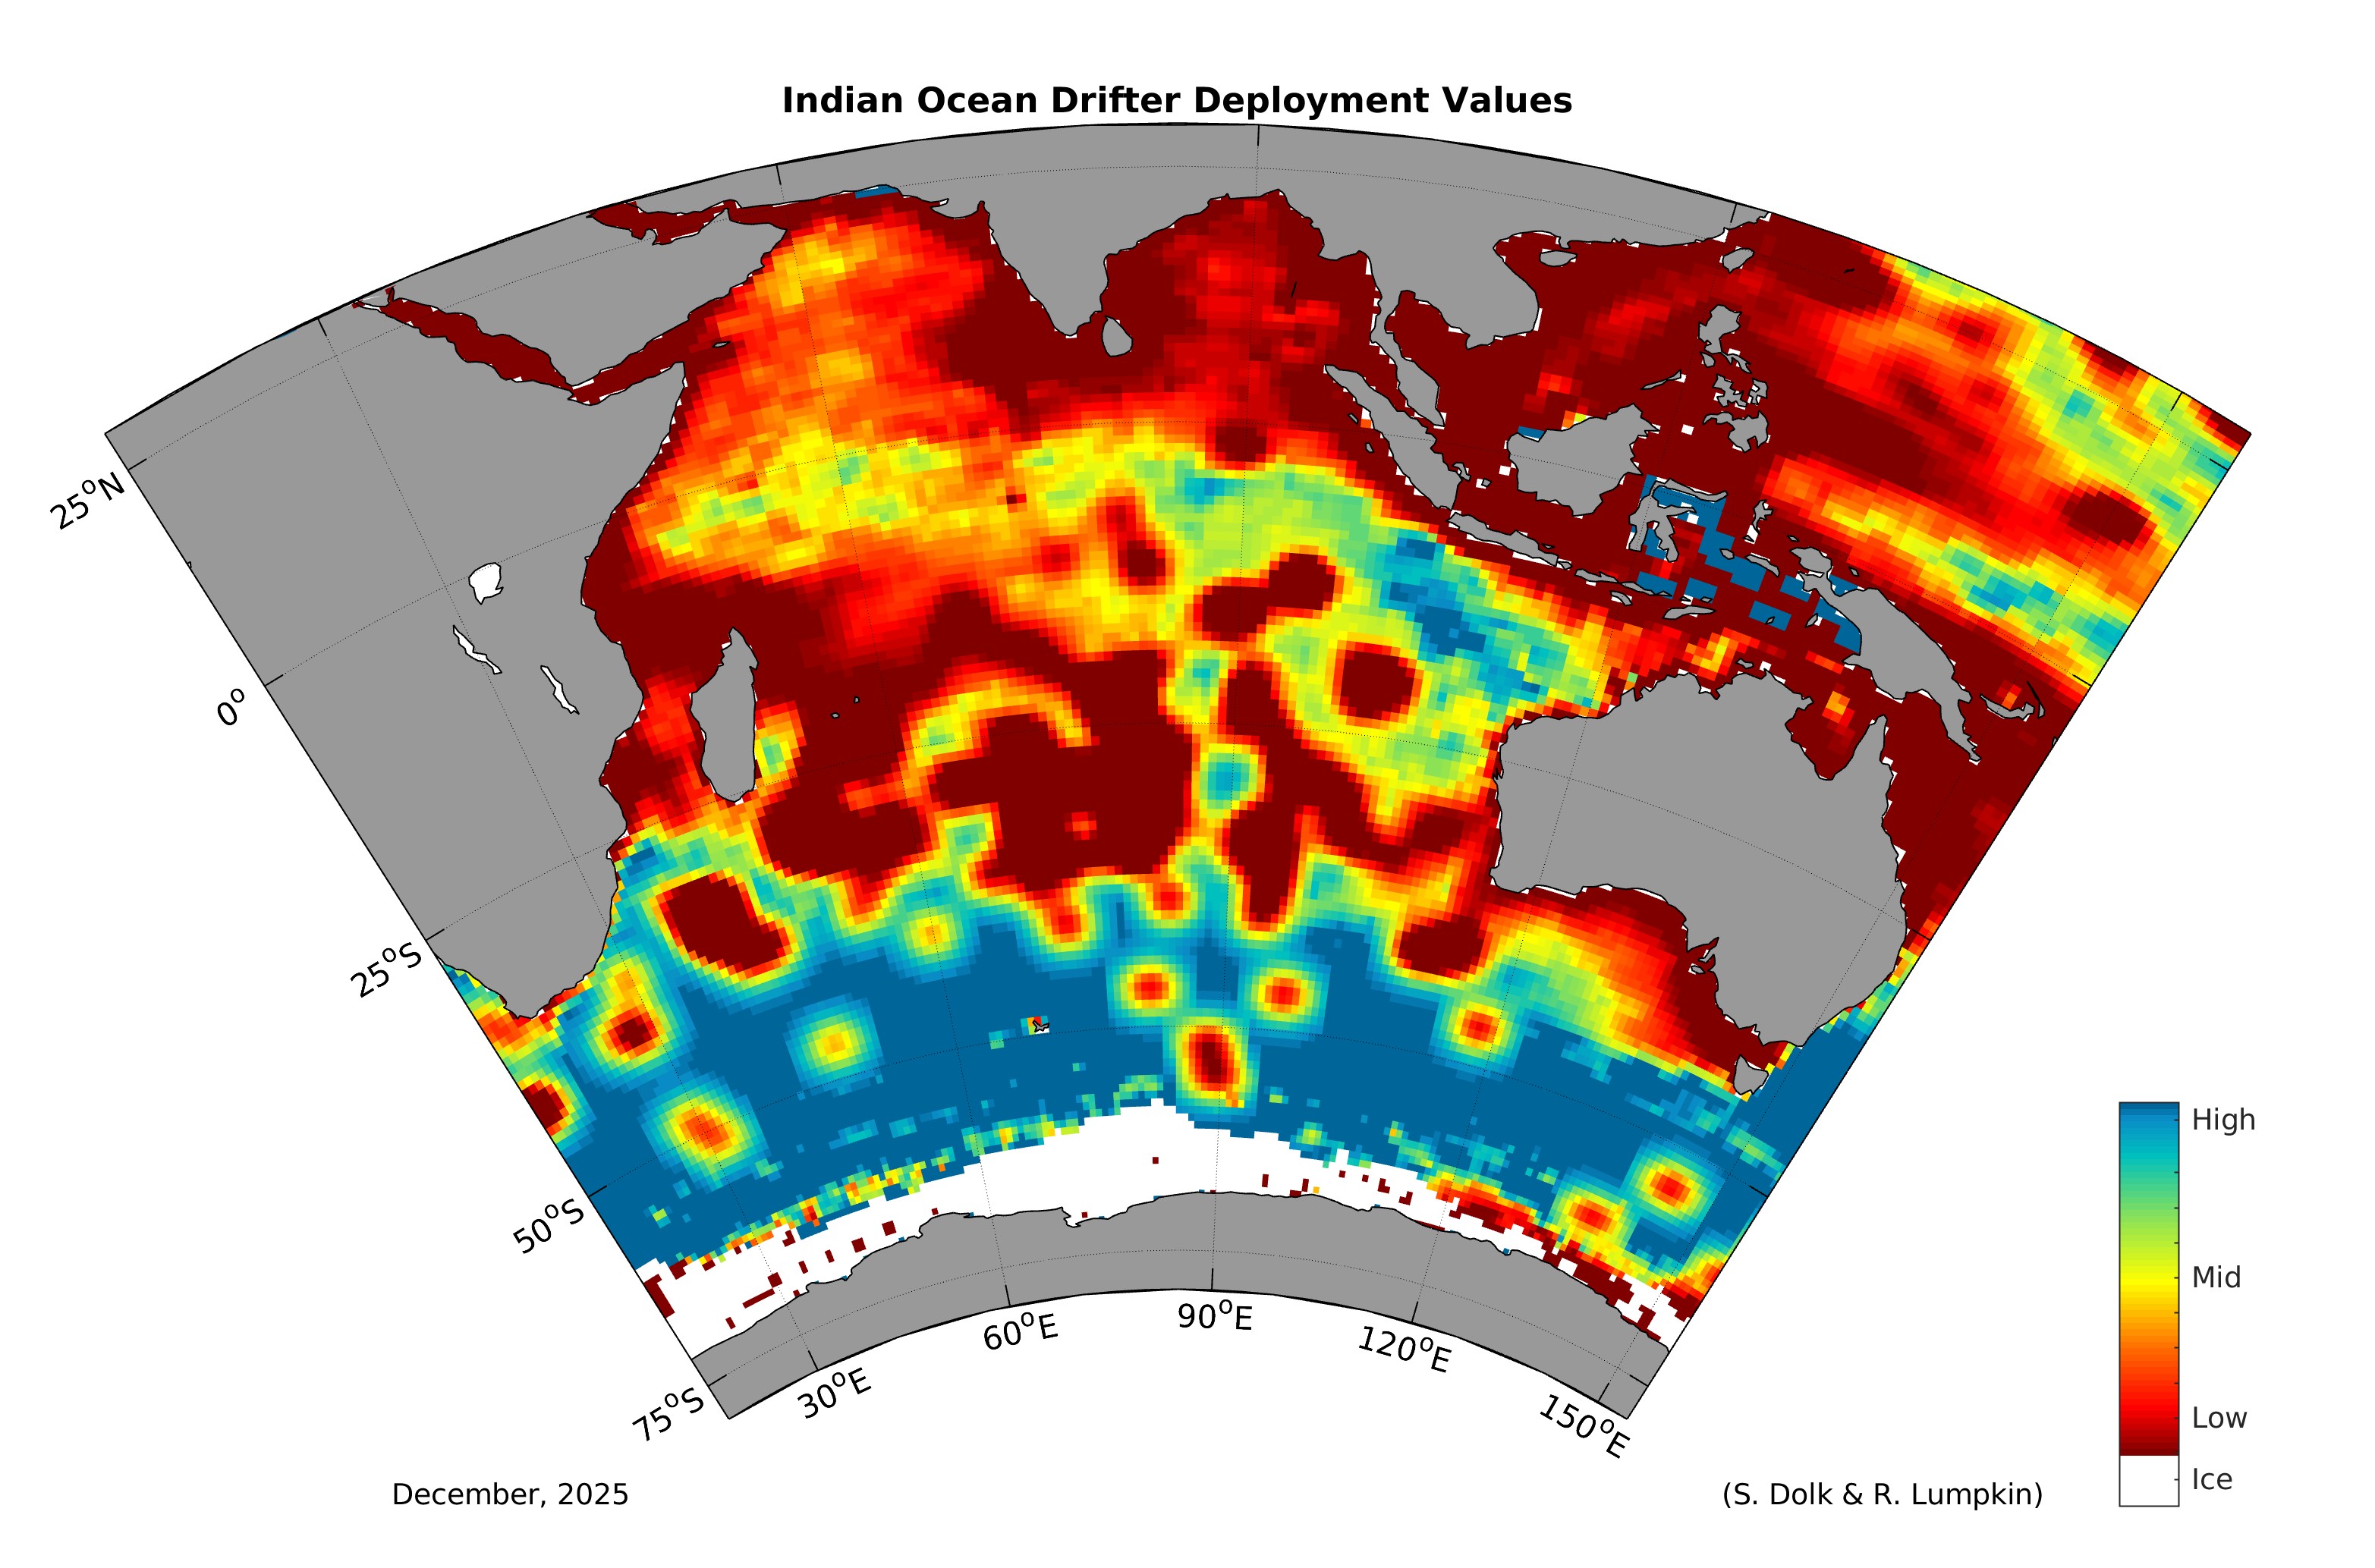
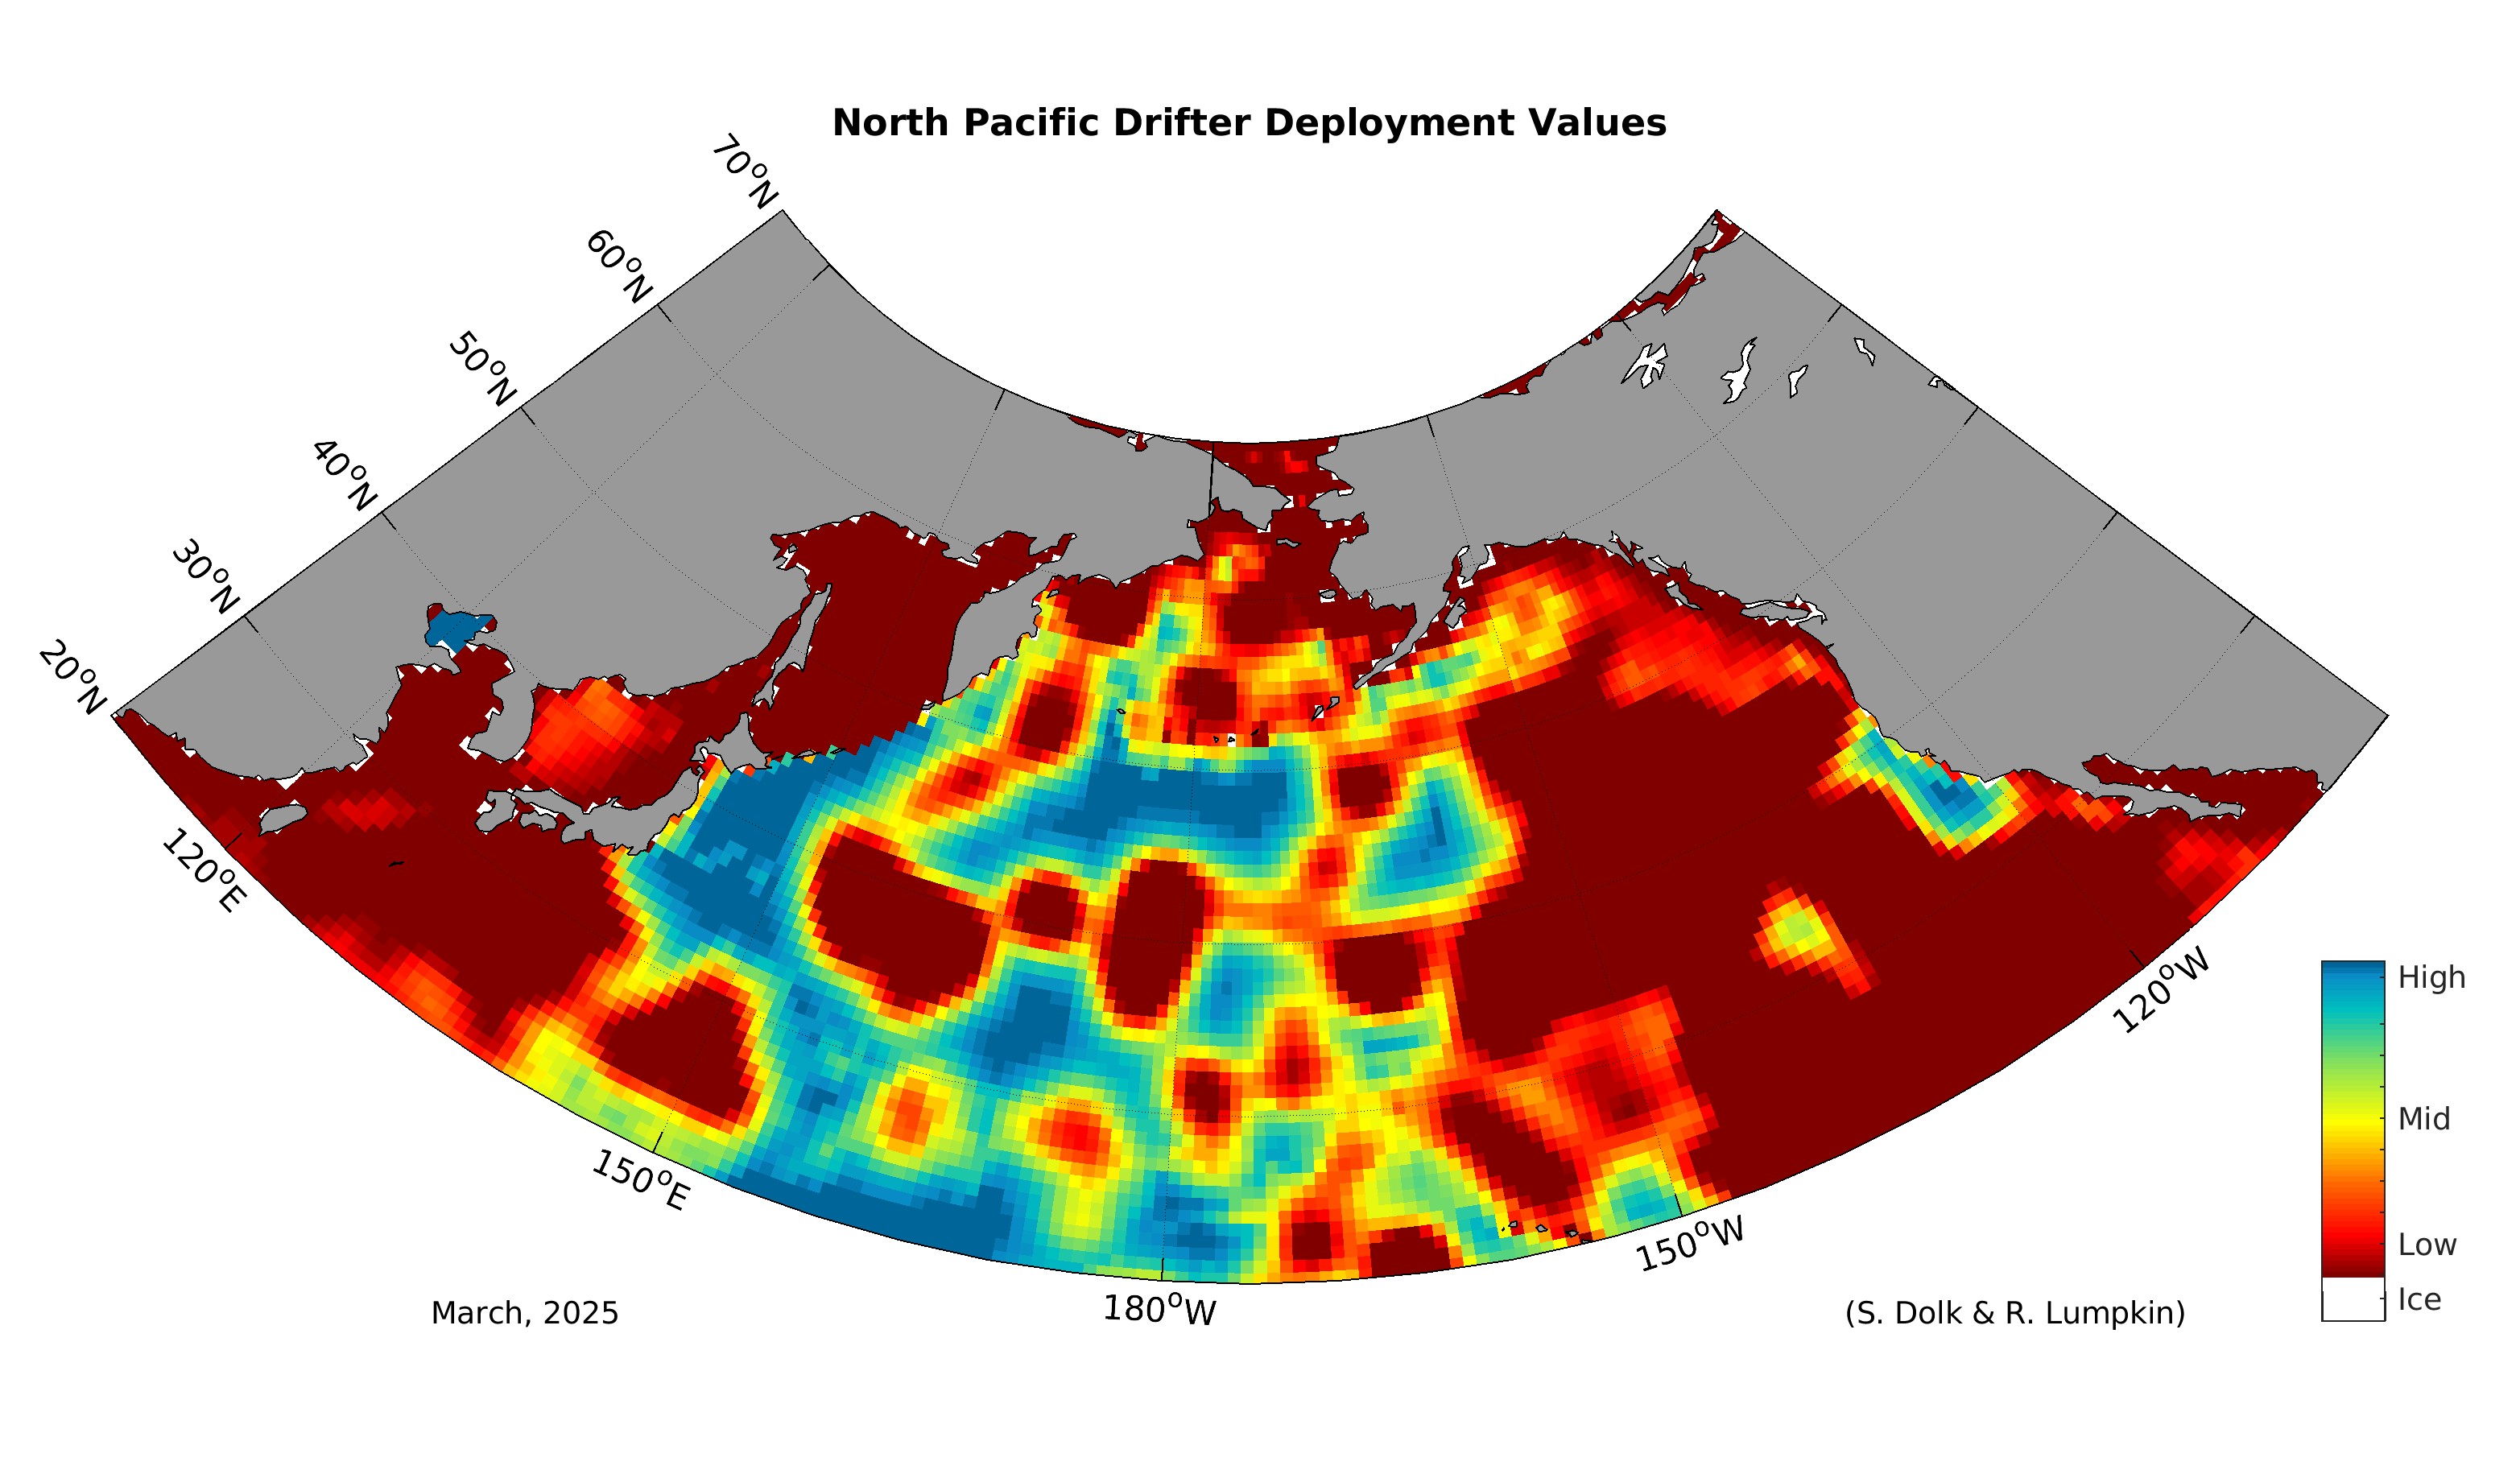
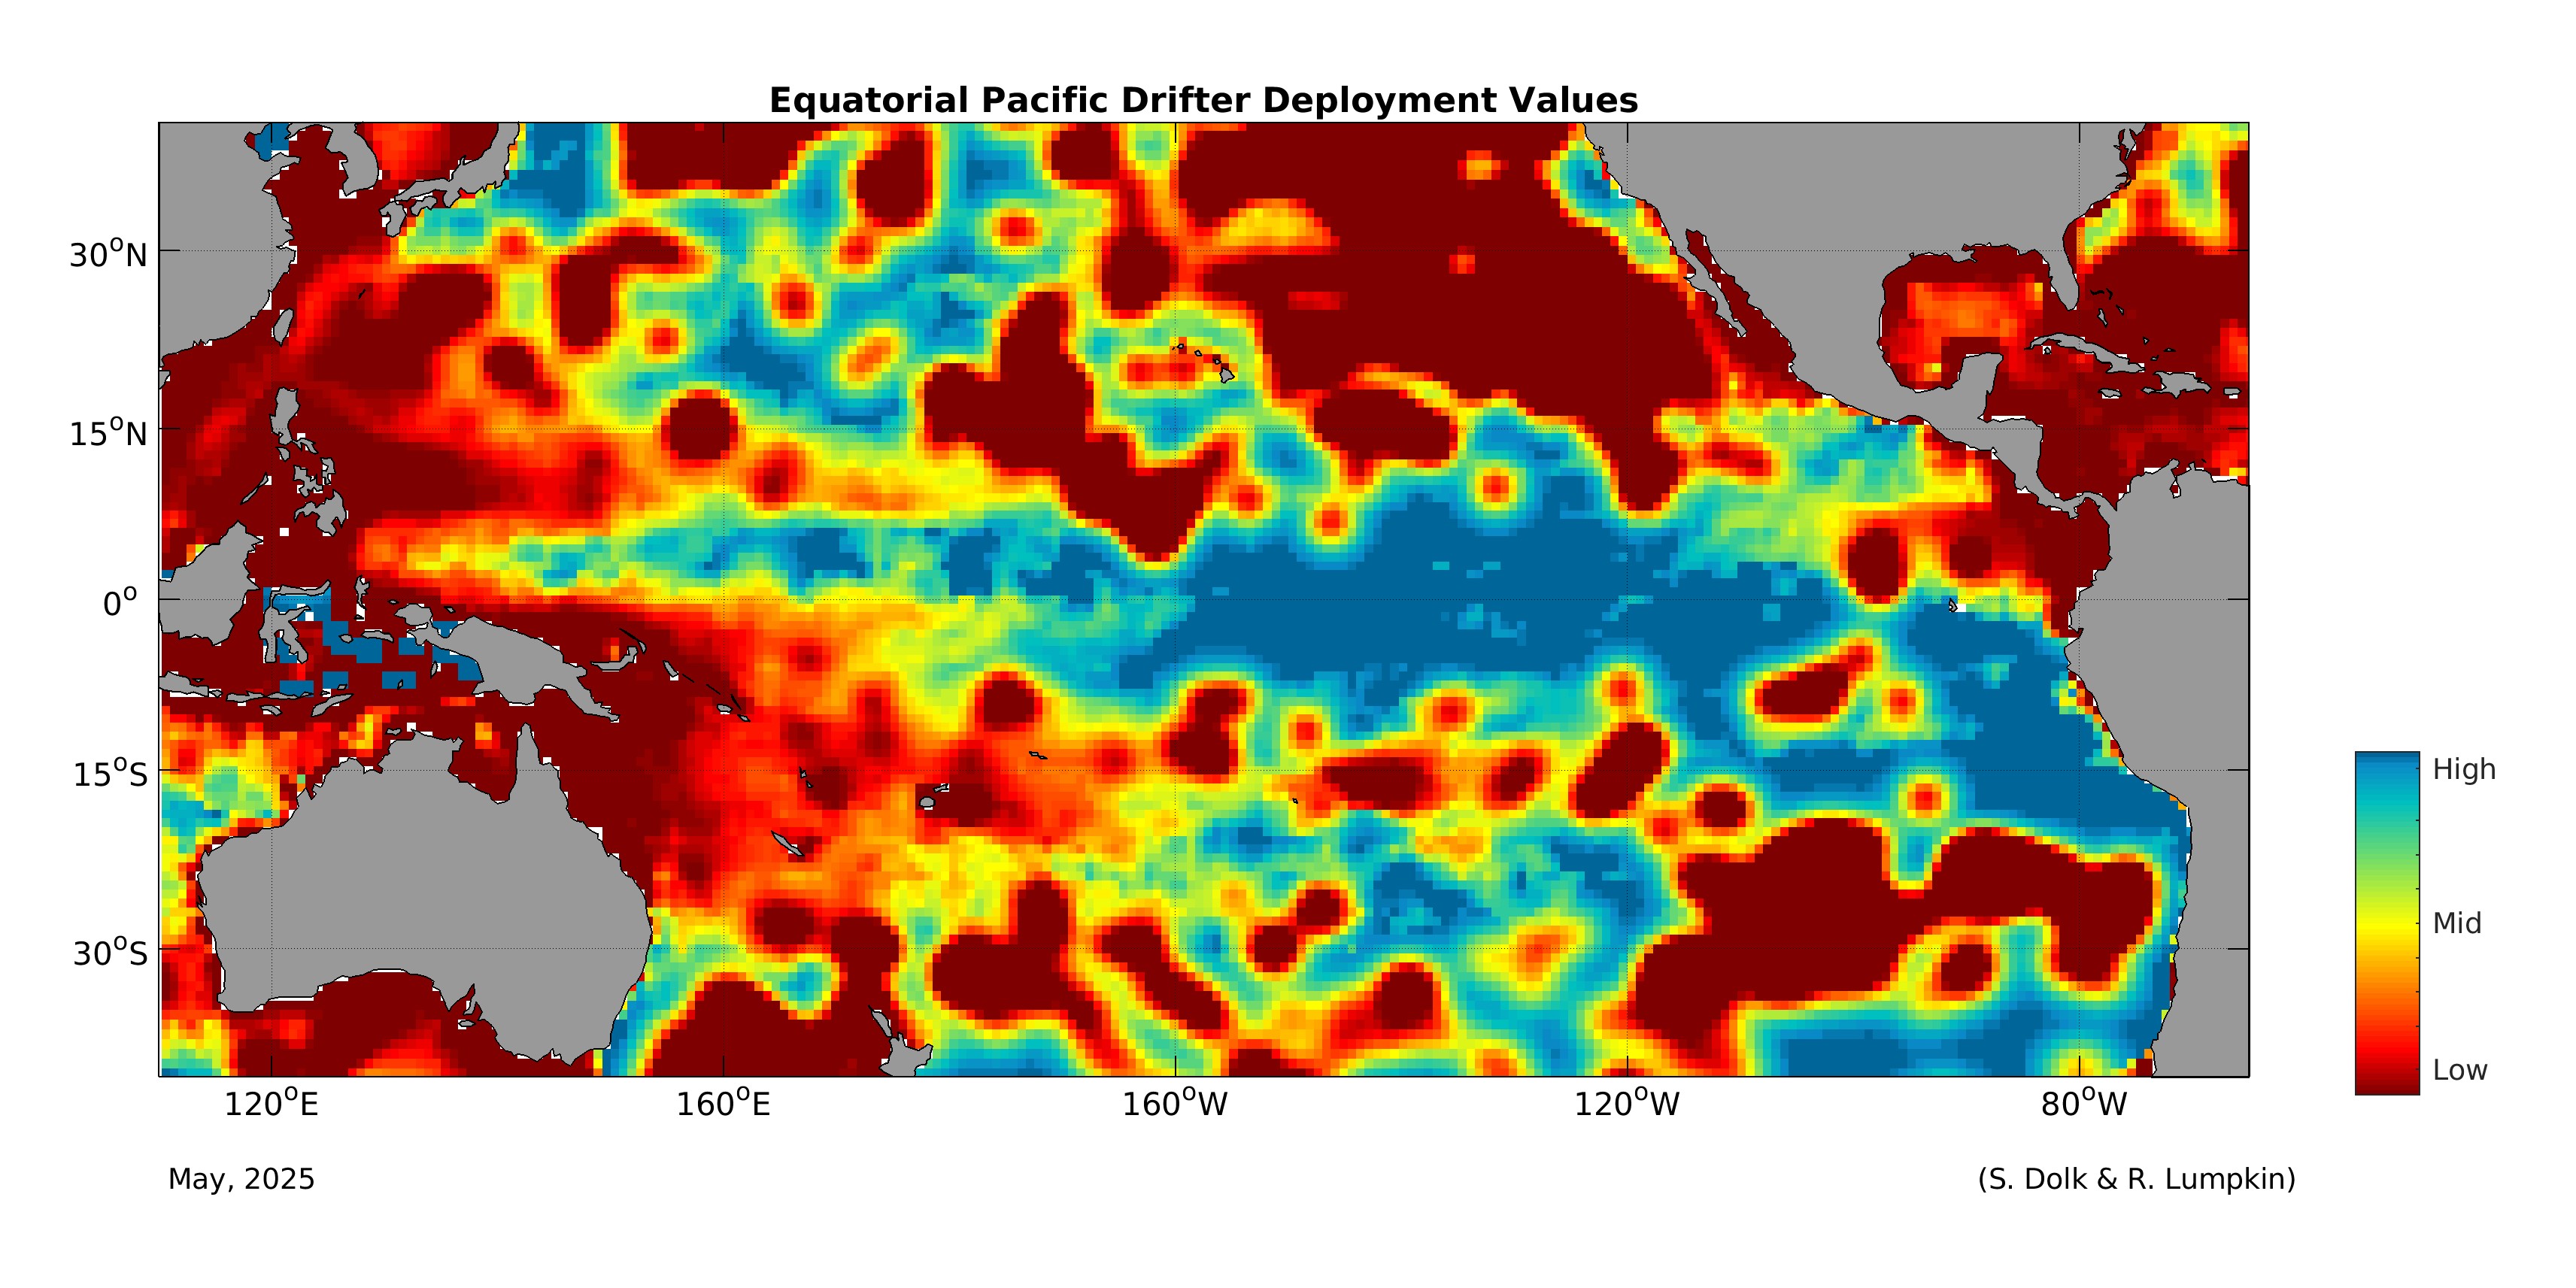
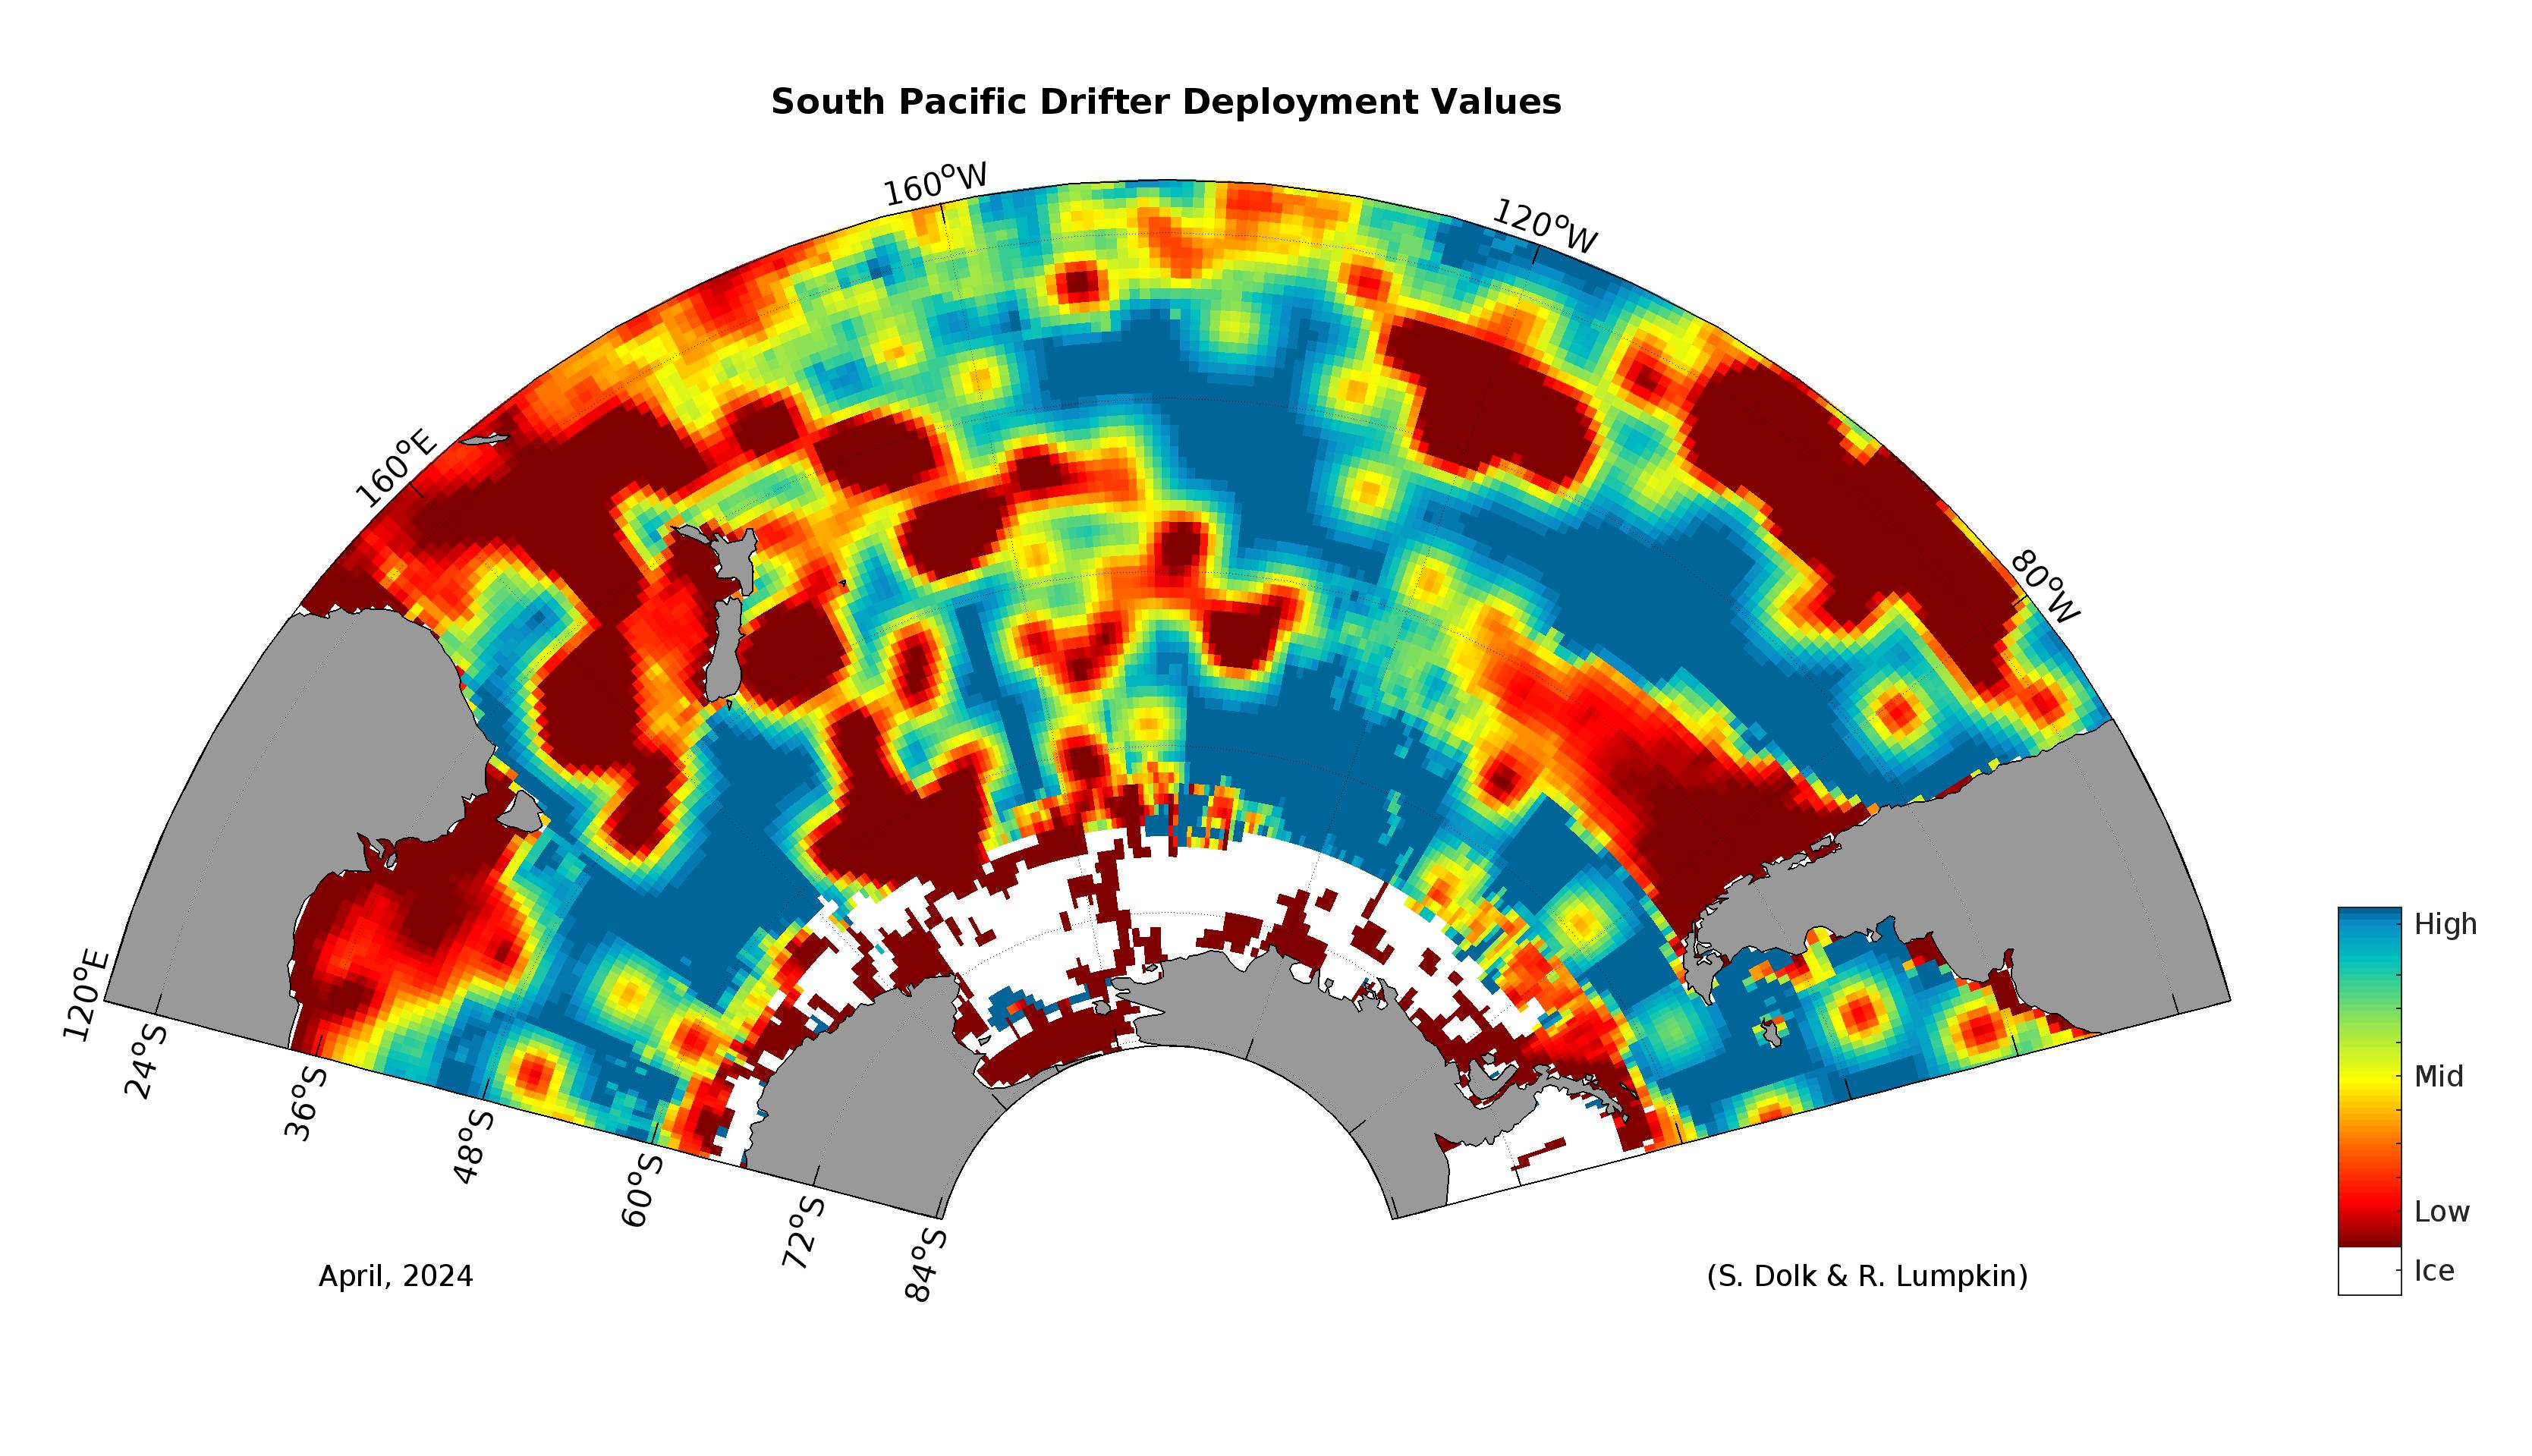
Drifter Deployment Value Maps
The goal of the drifter program is to implement one drifter in each 5° x 5° grid section of the oceans across the globe. Of course, with strong convergent and divergent currents to contend with, as well as limited access to deployment vessels, the Global Drifter Program works closely with more than fifty domestic and international agencies to coordinate deployment efforts.
To maximize spatial drifter coverage the Global Drifter Program created a set of Drifter Deployment Value Maps which are used throughout the community to identify the highest value deployment locations. Since drifters are shipped via ocean freight, it can take two weeks to four months to ship a drifter, depending on the destination.
View the maps below, or download our drifter deployment value text file, which shows values by latitude and longitude.
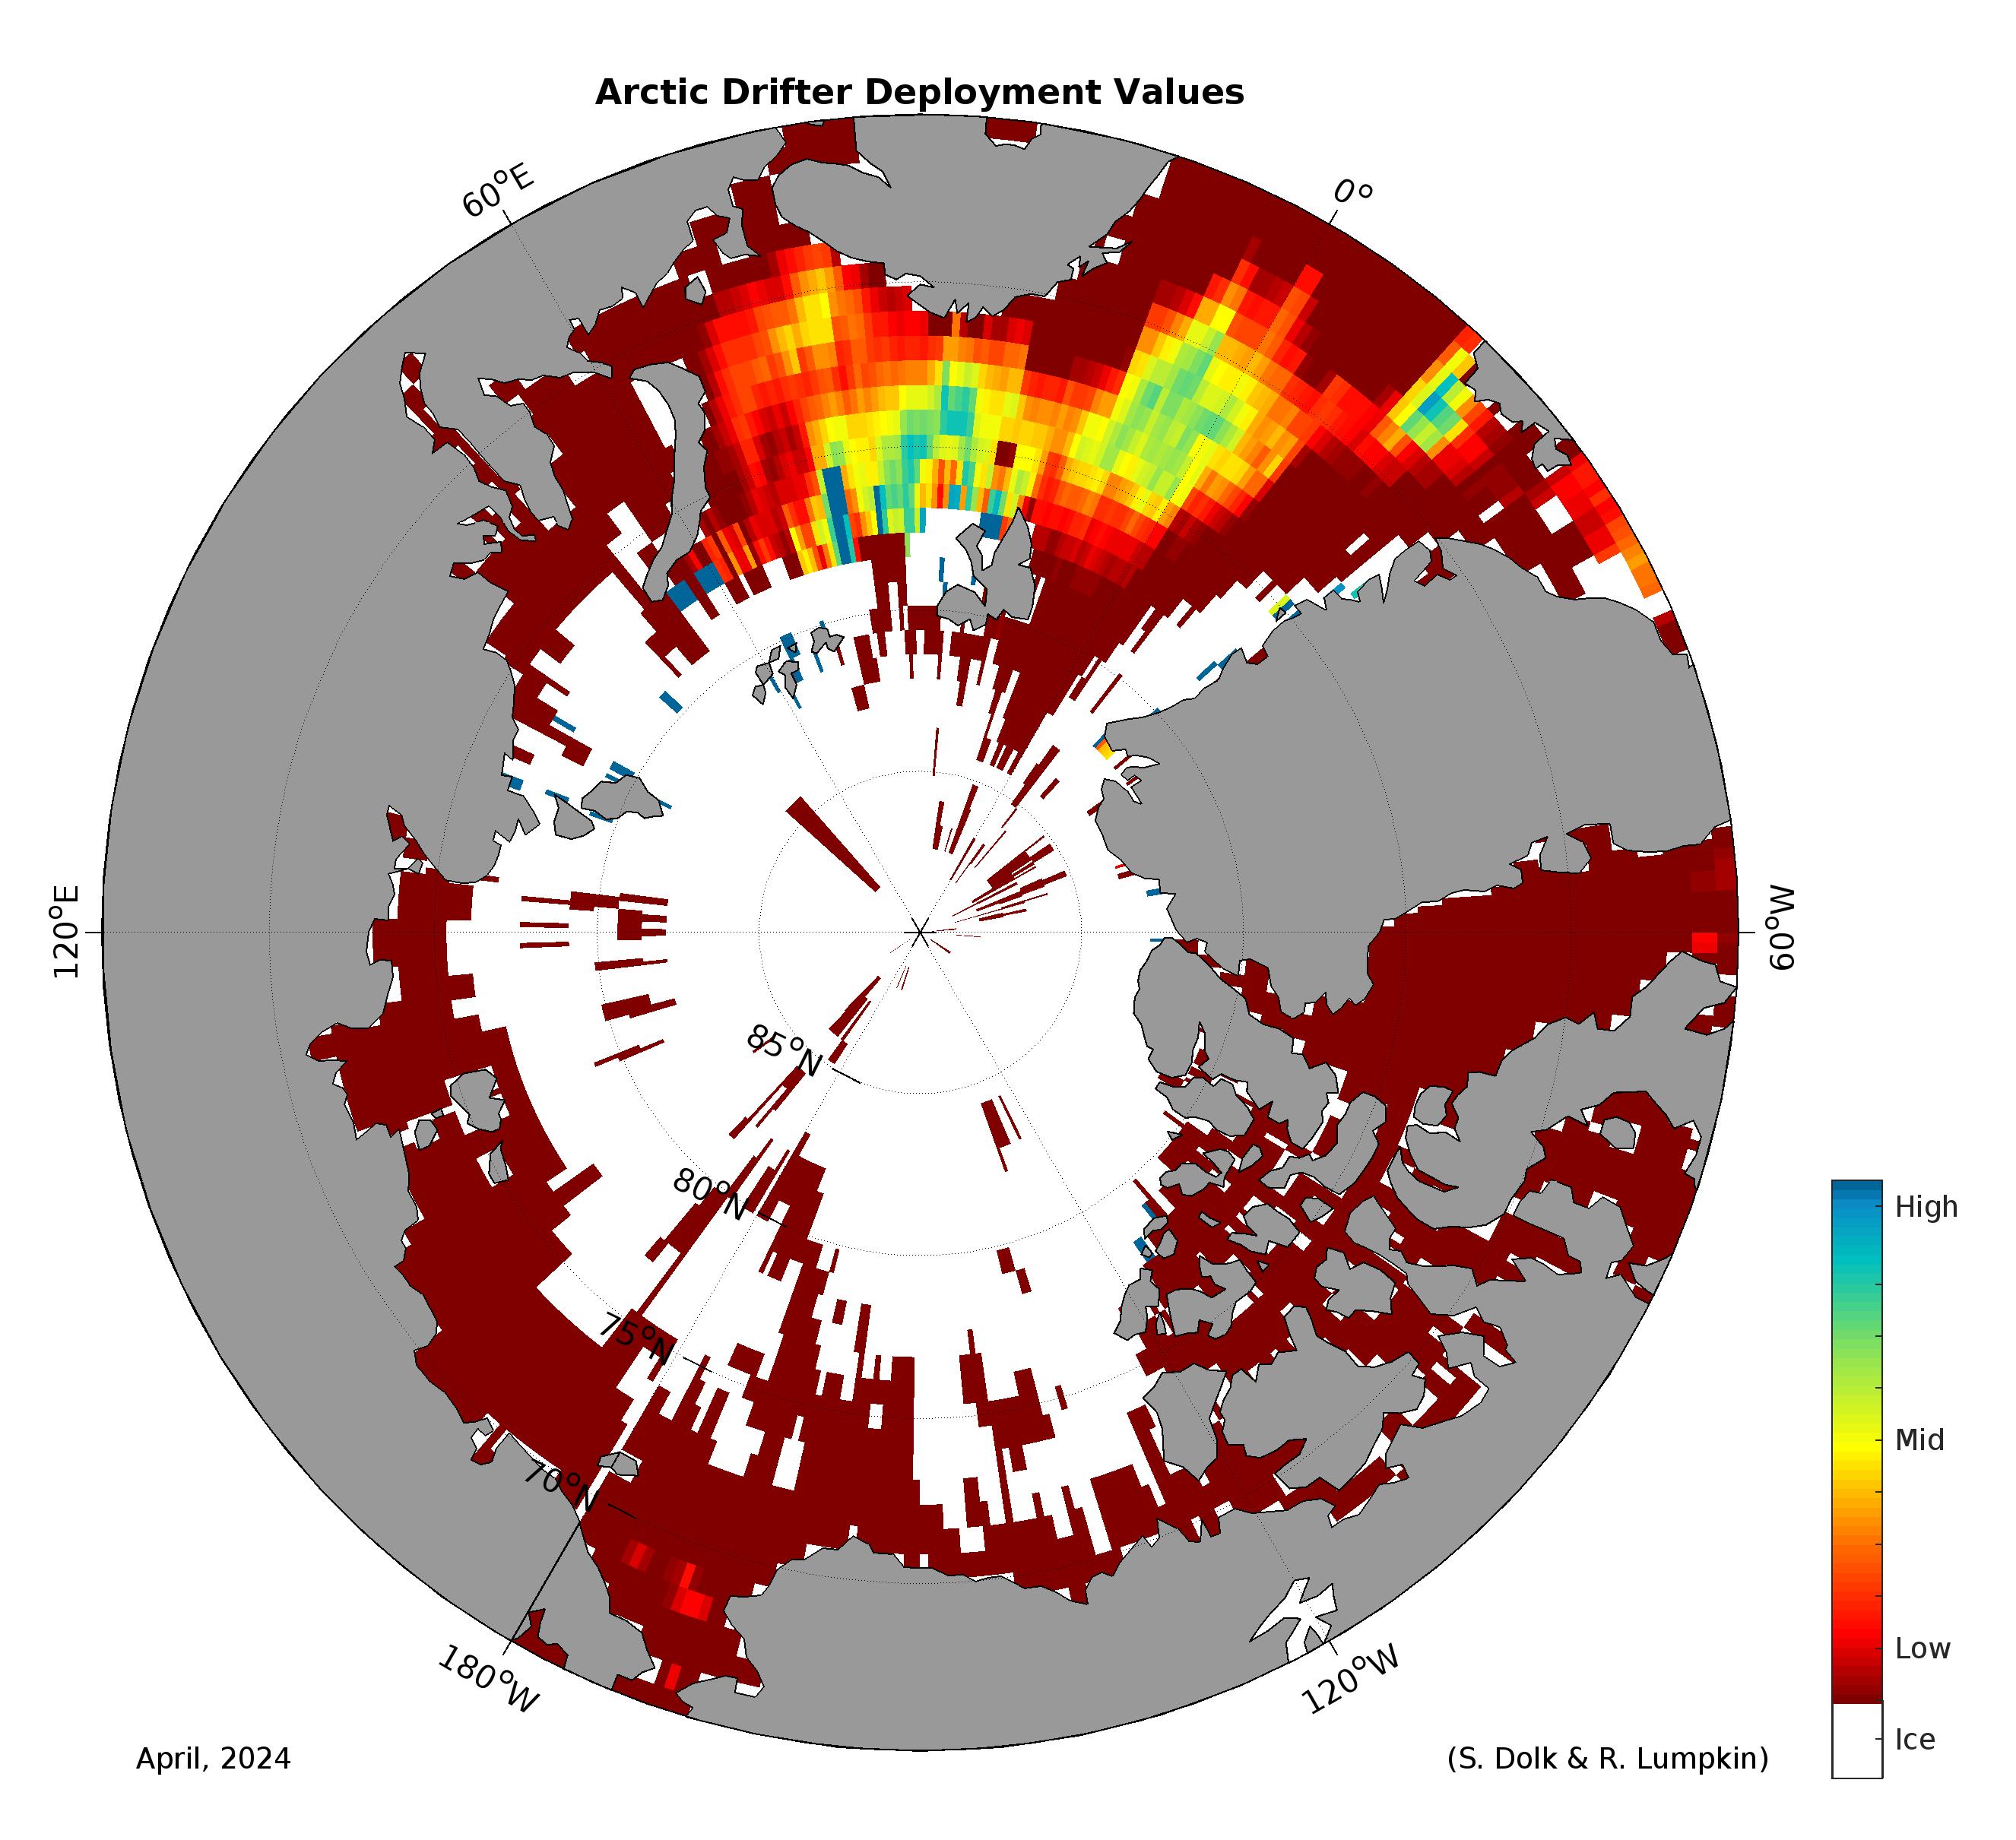
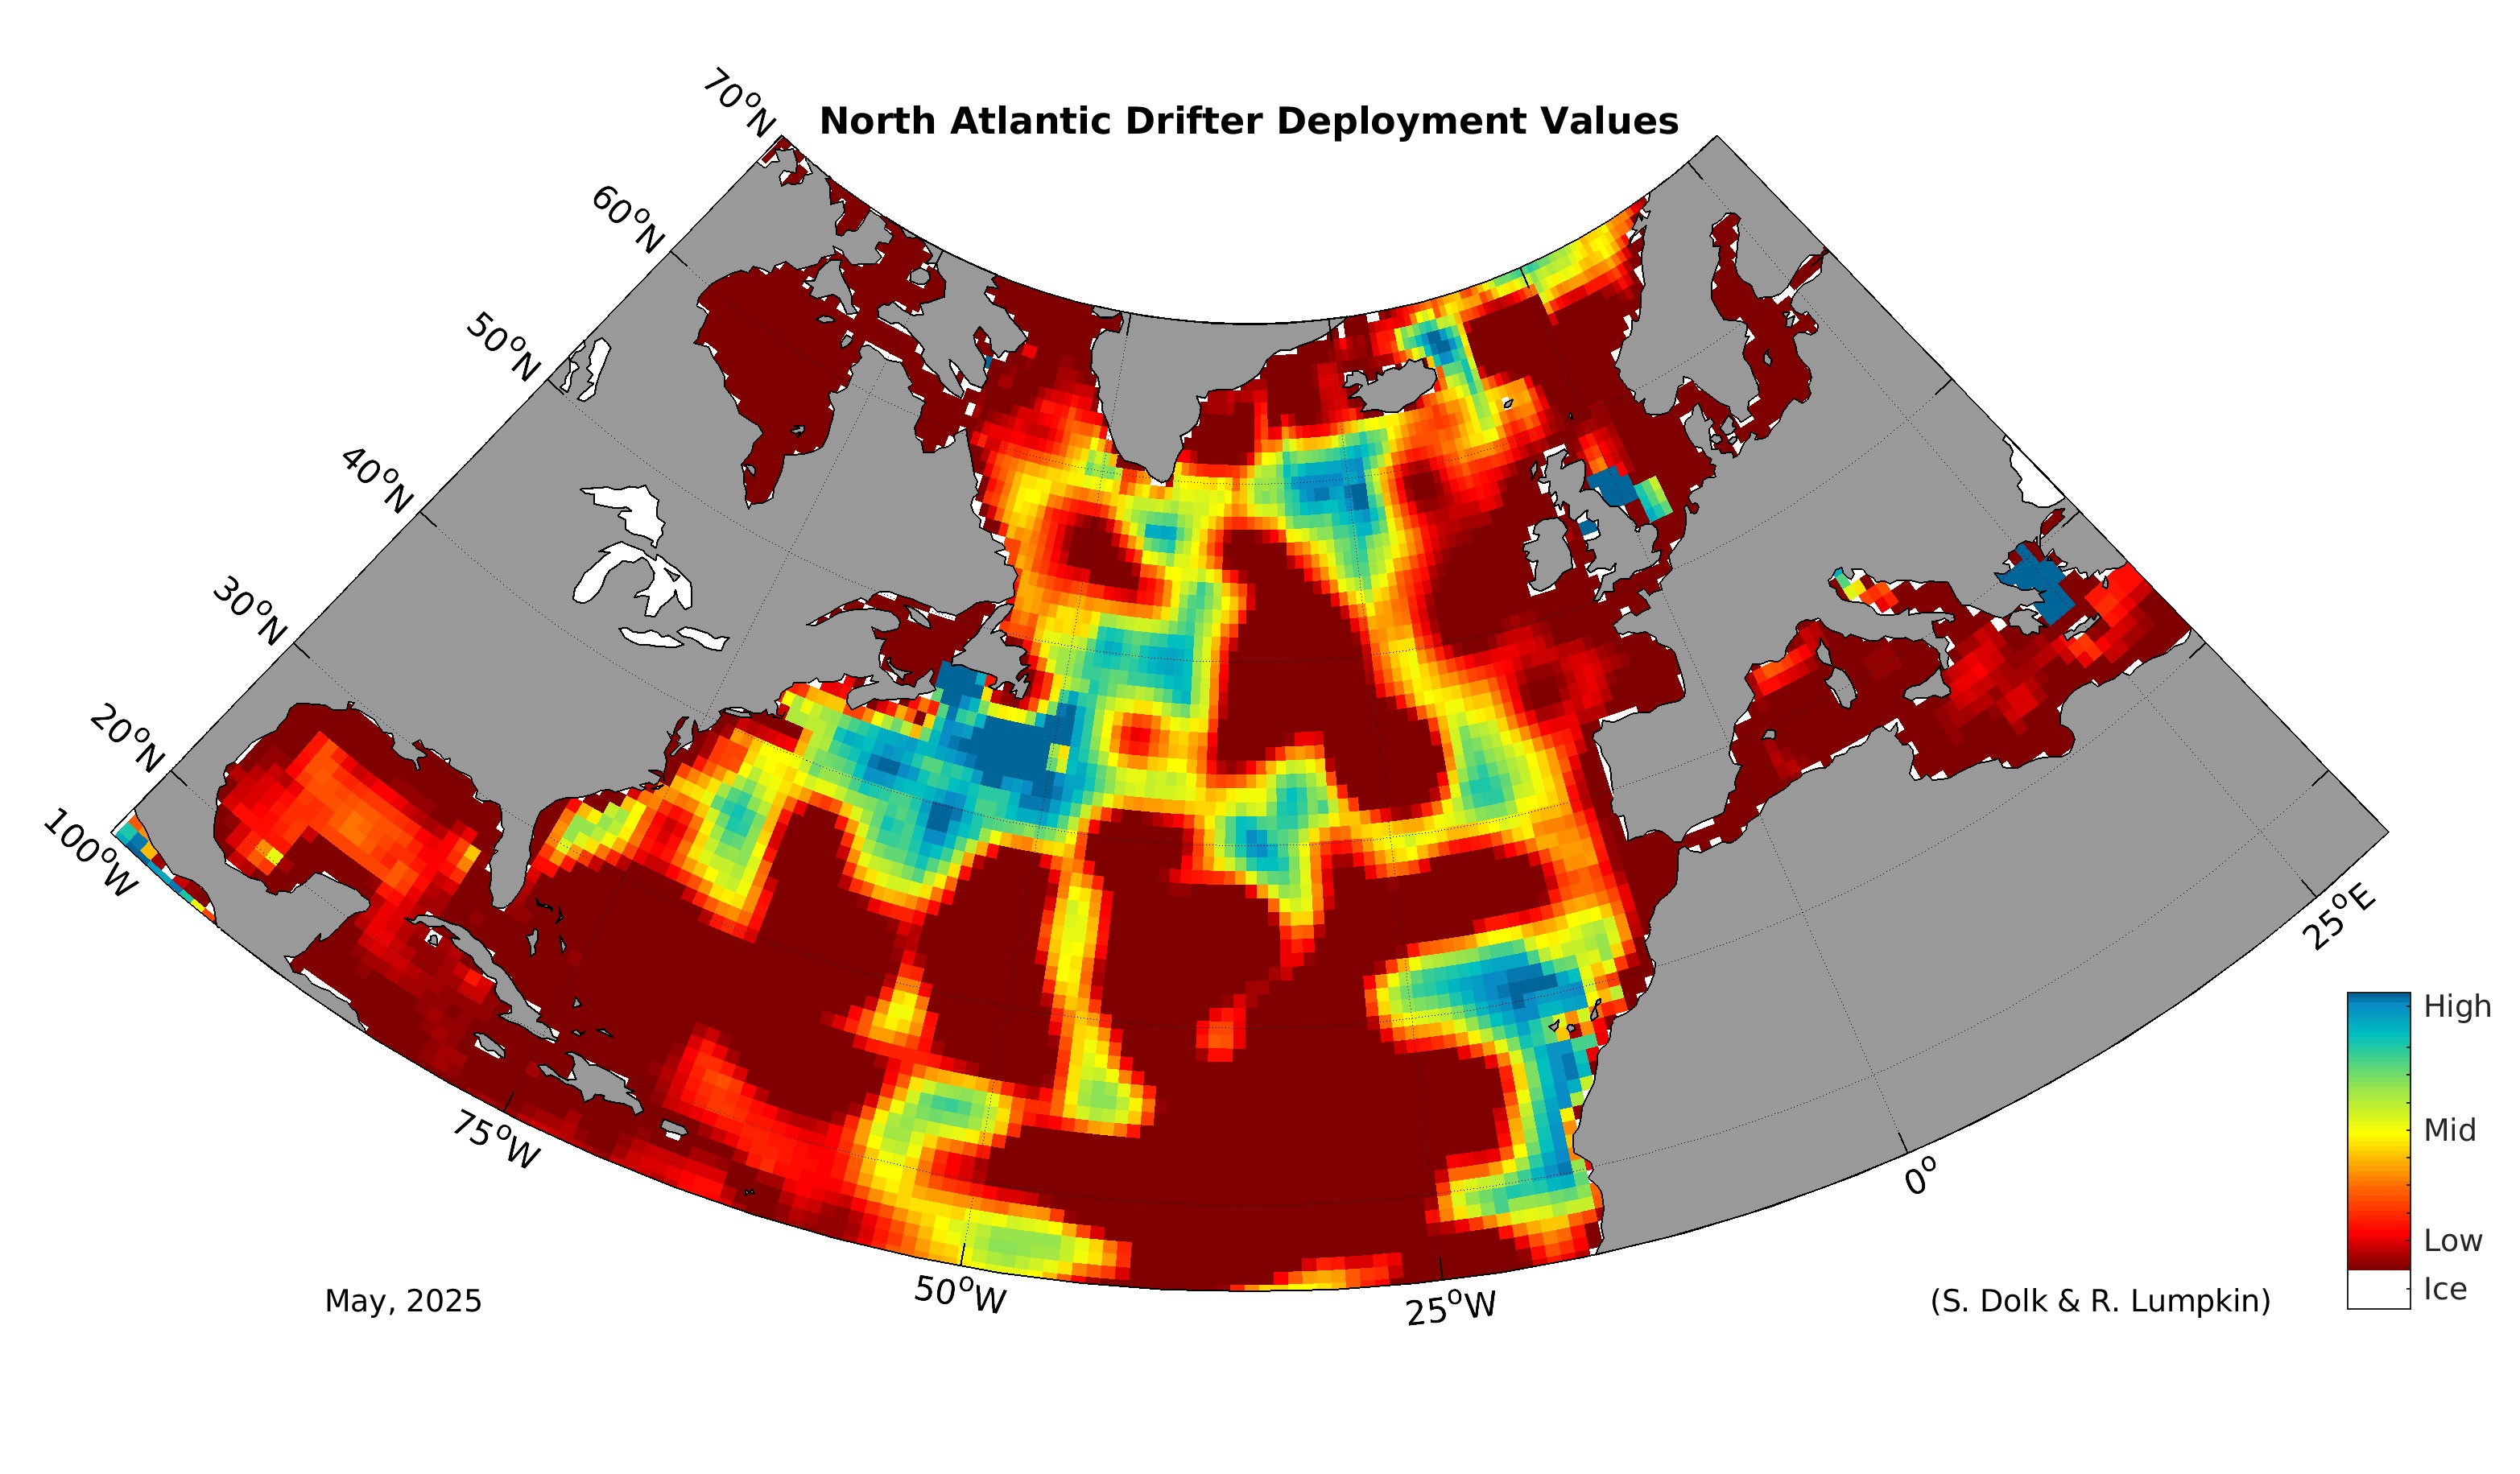
Regional Value Maps
Note: NaN values have been replaced with 999, while closed basis, areas shallower than 25m, and ice-covered regions are designated with a zero value.
The Arctic
The North Atlantic
The Tropical Atlantic
The South Atlantic
The Indian Ocean
The North Pacific
The Equatorial Pacific
The South Pacific
We are strong because of our community.
Deploy Your Own Drifter.
Deployments can be reported by clicking report deployment or by emailing drifter.deployment@noaa.gov.
Outreach Partnerships
Adopt a Drifter Program
Drifters Teach Kids about Ocean Currents
Global Ocean Monitoring and Observing Program established the Adopt a Drifter Program in December 2004 for K-16 teachers from the United States along with international educators. This free program provides teachers with an educational opportunity to infuse ocean observing system data into their curriculum.
Participating teachers develop lesson plans to encourage their students to analyze and apply the drifting buoy data. Students in the teachers’ classes receive a drifter tracking chart to plot the coordinates of the drifter as it moves freely in the surface ocean currents. This enables teachers and students to more easily make connections between the drifter data maps accessed online and other maps showing currents, winds, and other factors.

The Ocean Race
Since 1973, competitors aboard world class sailing vessels have circumnavigated the globe during the Ocean Race (formerly known as the Volvo Ocean Race). While competition is fierce and victory is the ultimate goal, these competitors are generating legacies greater than their performance on the water. Race coordinators and competitors have worked tirelessly to incorporate scientific advancements and increase oceanographic and atmospheric data acquisition, including the deployment of drifting buoys. Read story here.
OceanX
OceanX and The National Oceanic and Atmospheric Administration forged a formal agreement to advance cutting-edge ocean exploration and scientific research that increases public understanding of the importance and value of the ocean. The partnership is in line with OceanX’s core mission to explore the ocean and bring it back to the world. To learn more about OceanX and their scientific research, media production and exploration vessel, OceanXplorer, please visit OceanX.org.
Additional Programs

Ocean Odyssey Web Game
NOAA’s Adopt a Drifter Program’s (ADP) first summer intern designed and developed Ocean Odyssey: Tracking Marine Debris, a NOAA SciJinks web game suitable for K-12 audiences.
Ocean Odyssey incorporates historic drifter data and helps middle school audiences understand how ocean surface currents transport marine debris and how users can help keep our oceans clean. The new SciJinks game is the latest addition to the ADP’s growing list of resources for educators! Teachers can now introduce the topic of ocean surface currents and marine debris in an informative and fun manner.
Driving Innovative Science with Data
The array of global drifters has created a vast network of time-series data about our oceans and how they move. This data has been used all over the world to study ocean basins, seas, and ocean features. Drifters are ideal for studying surface dispersion of any buoyant particles (such as fish larvae, oil spills, or marine debris) and for looking at how small ocean features contribute to the movement of larger ones. In addition, real-world drifter data has been used by scientists to improve the physics of water movement in ocean models.
Scientists do this by using real-world drifter observations to improve model accuracy. Temperature data from drifters has been used by scientists to study ocean processes, such as the heat content in the equatorial Pacific and how it impacts the equatorial cold-tongue of El Nino. Lastly, by combining drifter observations with satellite altimetry, some researchers have been able to produce topographical maps of ocean sea surface height over a set of years.

Real-Time Data
Real time drifter data are distributed on the Global Telecommunication System for improved weather forecasting and ocean state estimation. On this page, we provide instructions on how to obtain these Global Telecommunication System data streams using NOAA’s Observing System Monitoring Center.

6-Hour Interpolated Data
The Drifter Data Assembly Center at AOML applies quality control procedures to edit drifter data (position and temperature) and interpolates them to 6-hour intervals as described in Hansen and Poulain (1996). These data are ideal for climate research and span the period February 1979 to the most recent quality-controlled data.

Hourly Data
These data are quality controlled and interpolated to hourly positions as described in Elipot et al. (2016), and are ideal for studying high-frequency motion. They are a subset of the 6-hourly data, as most drifter data before 2005 were too coarse to interpolate to hourly values.
Drifter Frequently Asked Questions (FAQs)
Why is this instrument called a drifter?
These instruments sit at the surface of the ocean and are transported via near-surface ocean currents. They are not fixed to the ocean bottom, therefore they “drift” with the currents. For this reason, these instruments are referred to as drifters, or drifting buoys.
How do drifters work?
The surface float contains sensors that measure different parameters, such as sea surface temperature, barometric pressure, salinity, wave height, etc. Data collected from these sensors are transmitted to satellites passing overhead, which are then relayed to land-based data centers.
What parameters do drifters measure? / What sensors are possible?
All drifters measure sea surface temperature and location; the locations are used to calculate ocean current velocities. Additional sensors can be added such as barometric pressure, salinity, wave height, wind speed and direction, optical sensors, and internal surface float diagnostic sensors. Each measurement requires an additional sensor, while wave height measurements also require the absence of a drogue.
A barometer on the top of the float is used to measure sea level barometric pressure. These measurements have been shown to significantly improve weather forecasts.
Sea surface temperature is measured by a thermistor (thermometer) on the bottom of the float.
A salinity sensor (specifically, a highly accurate pair of conductivity and temperature sensors) is used to measure sea surface salinity at the base of the surface float. This can also be done deeper on the tether between the float and the drogue.
A sonic anemometer and a wind vane are used to measure wind speed and wind direction.
Do all drifters measure sea surface temperature?
All drifters are equipped with a sea surface temperature sensor at the bottom of the surface float, which sits approximately 15cm below the ocean surface.
Do all drifters measure ocean current velocities?
As long as the drogue remains attached, all drifters measure near-surface ocean current velocities. If the drogue is lost at sea, the wind and waves play a greater role in moving the drifter.
What is a drogue?
The drogue, also known as a sea anchor, extends approximately 20m deep and is designed to move with the near-surface ocean currents. Because the drogue and surface float are connected by a long tether, the surface float is therefore moving with the near-surface currents as well. Without the presence of a drogue, the surface float will also be transported by wind and waves, much as a ping pong ball or beach ball is pushed across the surface of a pool.
Why do drogues have different colors and patterns?
The GDP requires that drogues are made of cordura nylon with rip-stop, with specific dimensions, but the GDP does not require a specific color for their drogues. As a result, drogue manufacturers often use surplus cordura nylon material from other jobs, which may consist of fluorescent pink, neon green, or even camouflage.
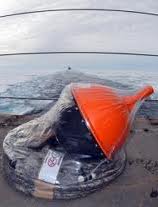
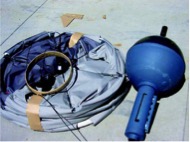
What does a drifter look like?
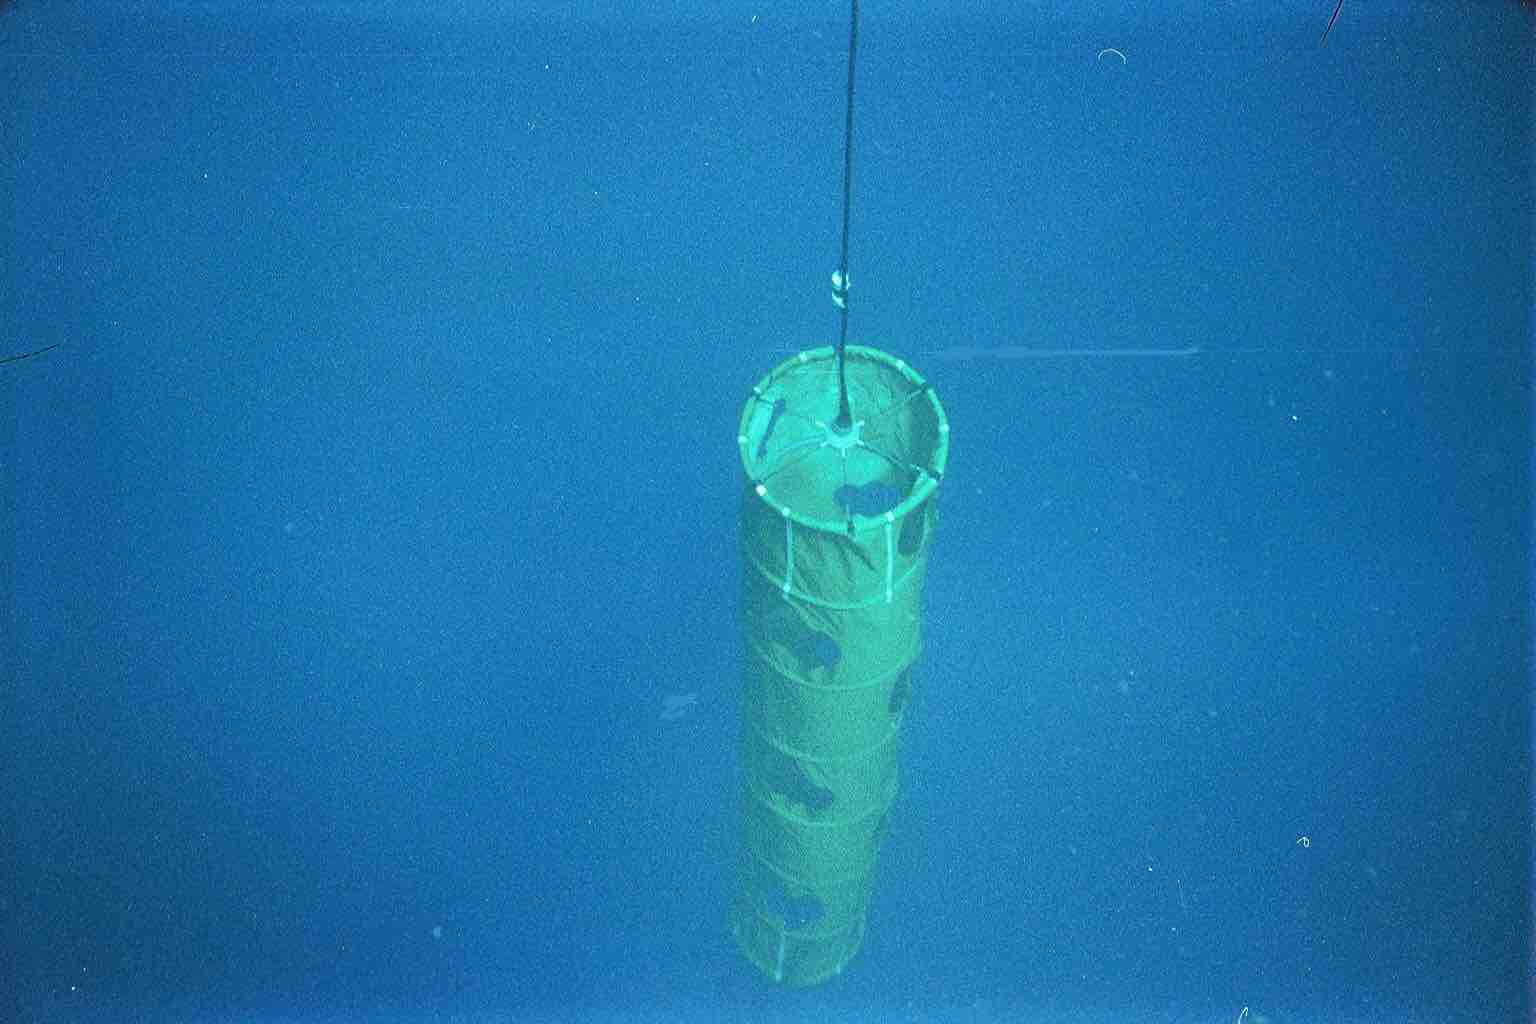
A drifter consists of a surface float, tether, and drogue (i.e., sea anchor). The surface float is buoyant and remains at the ocean surface, while the sub-surface drogue extends to roughly 20m depth (centered at 15 meters). The surface float and drogue are connected by a long, wire rope called a tether, which is encased in a polyurethane sheathing to provide added strength and prevent corrosion.
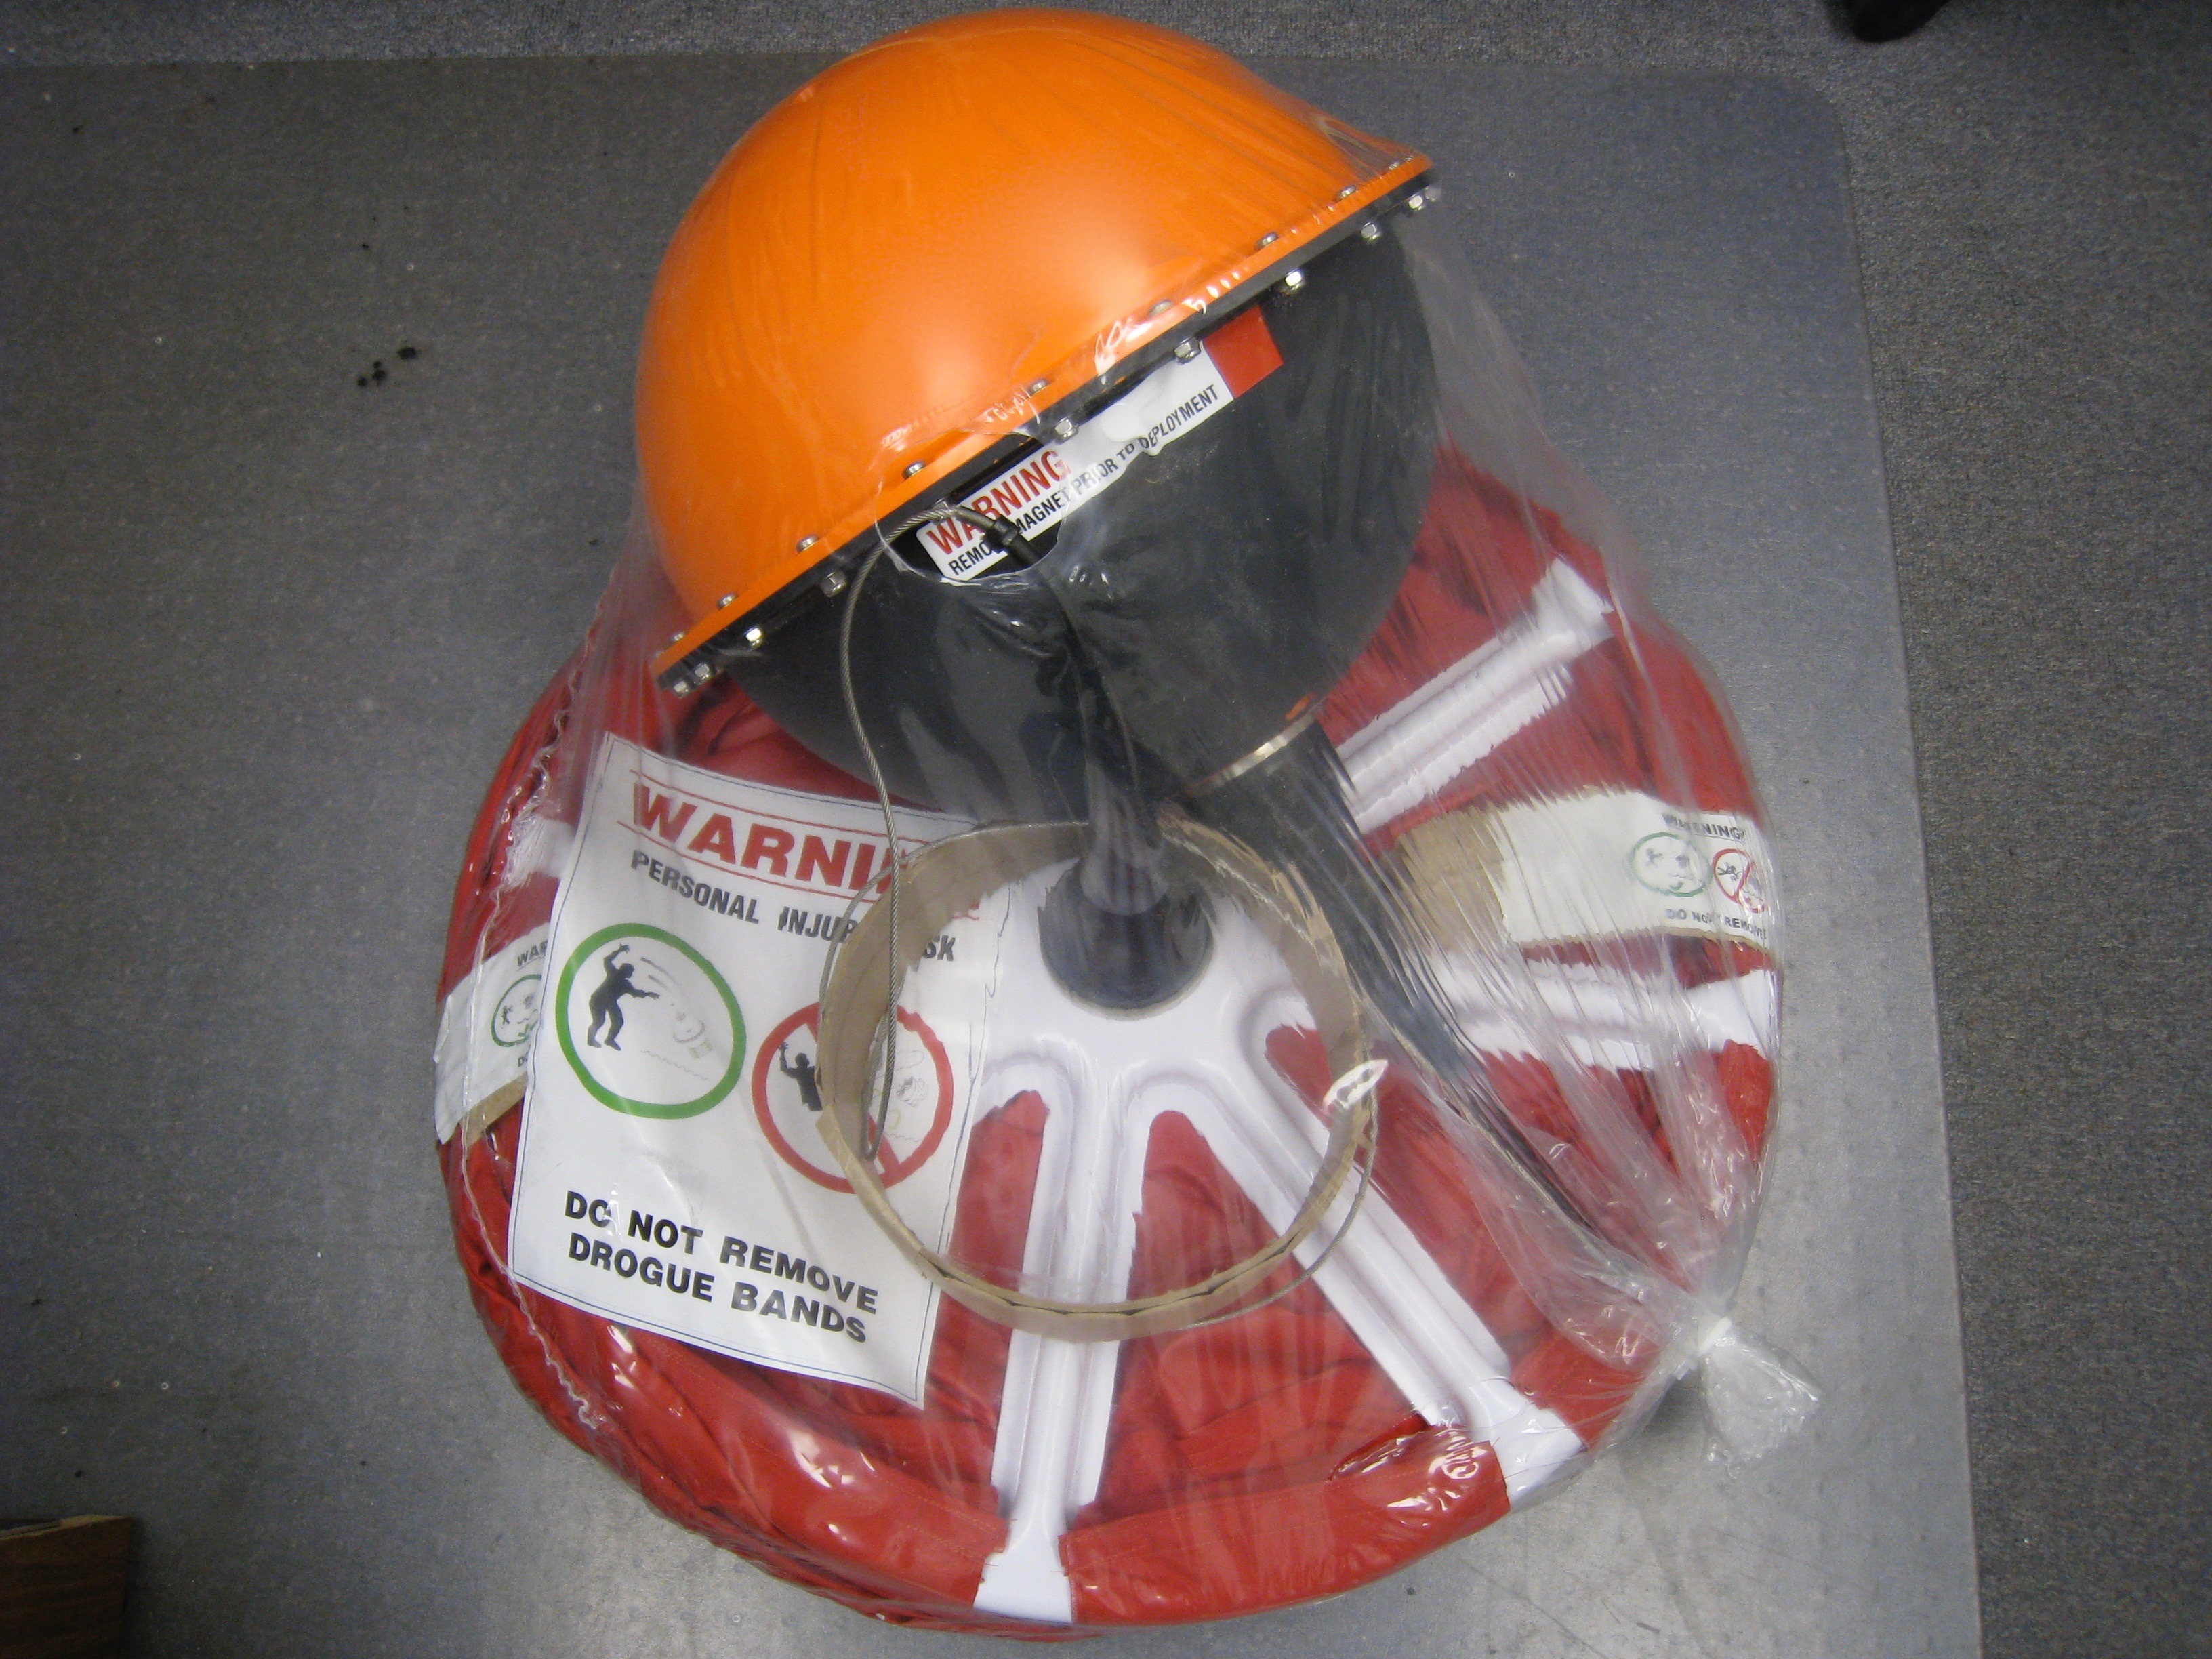
How large are drifters (weight and dimensions)?
The surface float ranges from 30.5 cm to 40 cm in diameter, while the drogue diameter is approximately 61cm. Total weight (of surface float and drogue) is roughly 50 lbs. Compressed and packaged for shipping/deployment, drifters measure roughly 61cm x 61cm. However, once deployed, the drogue and tether unfurl, extending to roughly 20m beneath the ocean surface.
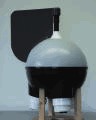
What are drifters made of?
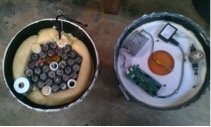
The surface float is made from form-injected ABS plastic. The surface float contains electronics that acquire and process sensor measurements, D-cell alkaline batteries to power the drifter, and an antenna to transmit the data. The tether is an impregnated polyurethane wire and the drogue is comprised of PVC tubing and nylon cloth material.
How is a drifter powered and how long does it last?
Drifters are powered by battery packs consisting of D-cell alkaline batteries, and are designed to last at least 18 months.
How long does it take to build a drifter?
It takes a considerable amount of time to design the electronic components and computer programs necessary, yet with all materials on-hand, it takes approximately 1 week to assemble each drifter. Of course, manufacturers often build drifters in batches. Therefore, assembling components and testing a larger number of drifters at once increased production and minimizes the amount of time needed to shift from one procedure to another. While drifters are not assembled on a conveyor belt, imagine this process as an assembly line, as each drifter within the batch receives the same components before moving on to the next item on the production checklist.
How much does a drifter cost?
Drifter pricing varies from one manufacturer to another, so we encourage you to contact each manufacturer for a detailed quote. That said, a standard Surface Velocity Program (SVP) drifter costs roughly US$1,800, with additional expenses for added sensors (e.g., ~US$1,500 for a barometer, ~US$6,000 for salinity, ~US$4,500 for wind speed and direction, etc.)
Where can you buy a drifter?
Please find contact information for each of the commercial drifter manufacturers at aoml.noaa.gov/phod/gdp/manufacturers
What is the GDP?
The Global Drifter Program is a part of the Global Ocean Observing System, which maintains a 5 x 5 degree array of ~1300 drifters. The program manages the collection, analysis, and distribution of the data acquired by these drifters.
How is the GDP managed? / How is GDP organized?
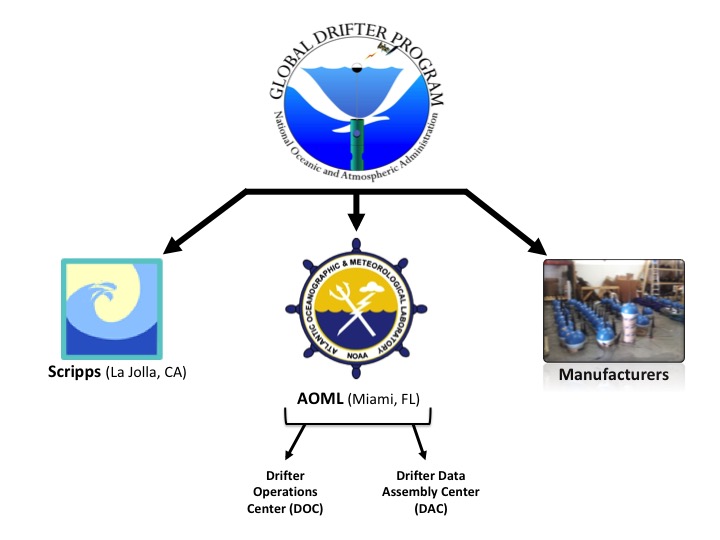
The GDP is managed with close cooperation between:
-
- Manufacturers in private industry, who build the drifters according to closely monitored specifications;
-
- NOAA’s Atlantic Oceanographic and Meteorological Laboratory (AOML), which coordinates deployments, processes the data, archives the data, maintains metadata files describing each drifter within the program, develops and distributes data-based products, and maintains the GDP website; and
- Scripps Institution of Oceanography (SIO), which supervises the industry, upgrades technology, and purchases most drifters.
Liaisons between the GDP and individual research programs that deploy drifters are maintained by Shaun Dolk (AOML) and Luca Centurioni (SIO).
What are the goals of the GDP?
The primary goal of the GDP is to establish a global array of drifters with drifters present in each 5 x 5 degree grid of open ocean and to provide these data in near-real time for weather prediction and ocean state estimation. The Global Drifter Program is also tasked with providing quality controlled data for scientific use.
When will the GDP array be complete?
The GDP array reached its goal size of 1250 drifters in a 5 x 5 degree array on September 18, 2005 and has been maintained since. It was the first component of the Global Ocean Observing System to reach completion.

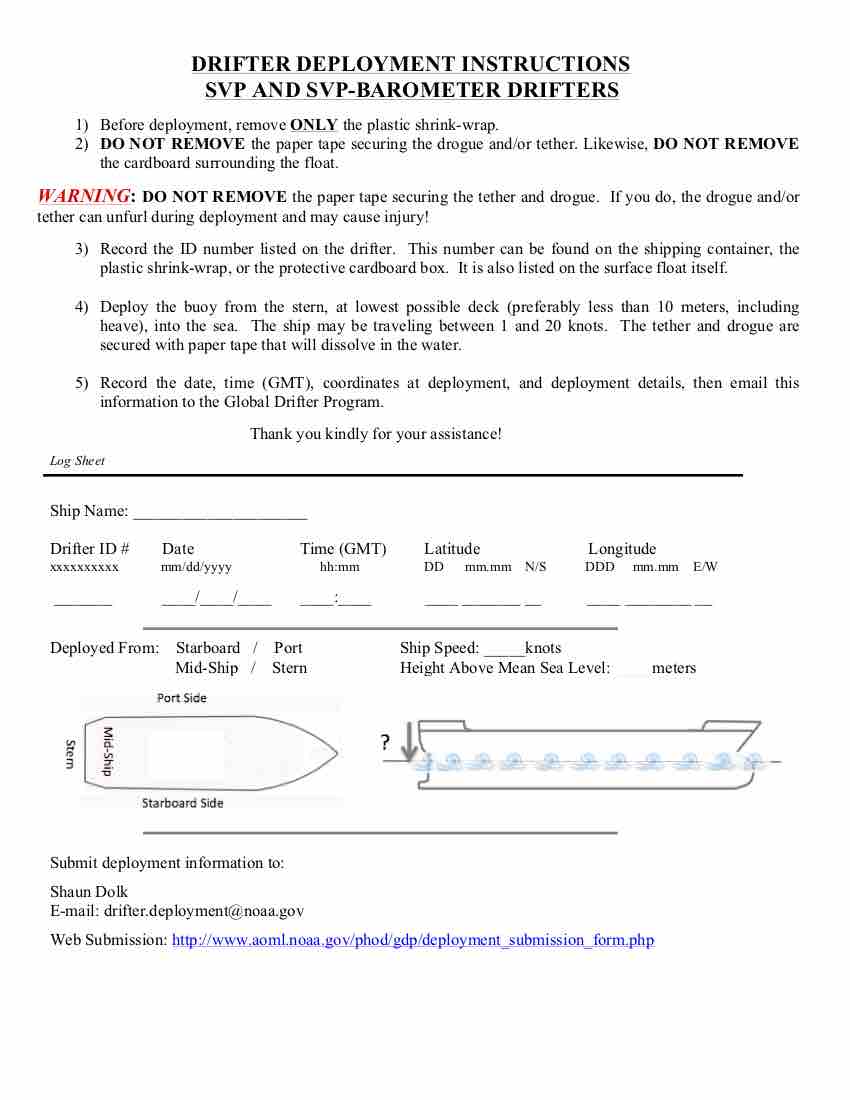
How do you deploy a drifter?
Where are drifters deployed?
Drifters are deployed throughout the world’s open oceans. To view a map of the current drifter locations (updated weekly), please visit aoml.noaa.gov/phod/graphics/dacdata/globpop_countries.
How many drifters are deployed each year?
Approximately 1000 drifters are deployed each year by the GDP and its international partners to maintain the global 5 x 5 degree array of ~1300 drifters. To view the number of deployments per year and their locations, please visit
aoml.noaa.gov/phod/gdp/maps_reports_archive.
How are drifter deployment locations determined?
The goal of the drifter program is to implement one drifter in each 5 x 5 degree grid across the globe. Of course, with strong convergent and divergent currents to contend with, as well as limited access to deployment vessels, the GDP works closely with more than fifty domestic and international agencies to coordinate deployment efforts. To maximize spatial drifter coverage and ensure its goals are met, the GDP created a set of Drifter Deployment Value Maps which are used throughout the community to identify the highest value deployment locations.
Who deploys drifters? / Who uses drifter data?
-
- Primarily oceanographers, meteorologists, and climatologists deploy and utilize drifter data. However, because drifter data can be used to track oil spills, marine debris, larval fish dispersion, etc. there is a growing list of deploying partners and data consumers.
-
- Oceanographic and climate researchers analyze the data to find aspects of the data that can be applied to other observations or explain phenomena.
- In an effort to better educate K-12 students about the importance of the ocean and how drifters provide invaluable data, the GDP works closely with NOAA’s Adopt a Drifter Program. Through the Adopt a Drifter Program, the GDP encourages young scientists how to access drifter data and its many applications.
How can students adopt buoys?
If you, or your classroom would like to adopt a drifting buoy, please visit the Adopt a Drifter Program and complete the application.
How long does it take to ship drifters across the world?
To minimize costs associated with global transport, drifters are shipped via ocean freight, on large container ships. Therefore, depending on the destination, shipments vary between a couple of weeks to four months for more remote and isolated regions of the world.
Do drifters pose any hazard to people, wildlife, the environment or shipping?
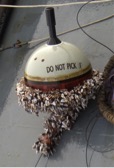
Drifters are not known to harm marine wildlife. Conversely, recovered drifters often contain crustaceans, which are known to attract larger species, creating a micro-habitat.
What’s the longest time a drifter has transmitted quality data?
The longest lasting drifter on record transmitted for 10 years, 4 months, and 21 days.
What should I do if I find a drifter?
If you find a drifting buoy, please contact a member of the Global Drifter Program with any/all information listed on the surface float. If the drifter remains active, with functional batteries and operational sensors, we’ll attempt to have the drifter re-deployed. If the batteries and/or sensors are no longer operational, the drifter can be disposed. These drifters contain no hazardous material, so simply dispose of the drifter as you would any other alkaline battery product.
What if I have additional questions about drifters?
-
- If you have general questions about drifters that were not covered within these FAQ’s, we encourage you to explore this webpage for additional information and resources.
-
- If you have specific questions about drifter deployments, please contact Shaun Dolk.
What if I have questions about drifter data?
If you have more specific questions about drifter data, please visit the Drifter Data FAQ
- Should you have additional questions and wish to speak with a member of the GDP, please email Shaun Dolk.
Drifter Data Frequently Asked Questions
Who uses drifter data?
- Primarily oceanographers, meteorologists, and climatologists deploy and utilize drifter data. However, because drifter data can be used to track oil spills, marine debris, larval fish dispersion, etc. there is a growing list of deploying partners and data consumers.
- Oceanographic and climate researchers analyze the data to find aspects of the data that can be applied to other observations or explain phenomena.
- In an effort to better educate K-12 students about the importance of the ocean and how drifters provide invaluable data, the GDP works closely with NOAA’s Adopt a Drifter Program. Through the Adopt a Drifter Program, the GDP encourages young scientists how to access drifter data and its many applications.
What is a data fix?
While possible to increase/decrease the time interval between data transmissions, the standard transmission rate for drifting buoys is one transmission per hour, at the top of each hour. A fix is when a satellite receives a particular transmission and relays it to a land-based data center.
What is kriging?
Kriging is an optimum interpolation procedure which is commonly used for two and three-dimensional analyses. It is the method used at the drifter Data Assembly Center to interpolate (fill in the gaps in the data) and make them equally spaced into six hour intervals.
See Hansen, D.V. and Poulain, P.M., 1996, [PDF] for a complete description of the quality controlled and interpolation procedures applied to the drifter data in this database.
What is a Weighted Maximum Likelihood Estimate (WMLE)?
WMLE is an optimized model for the most likely location of a drifter given an estimate and a known error range. It is the method used at the drifter Data Assembly Center to interpolate (fill in the gaps in the data) and make them equally spaced into hourly intervals.
For more information, see Elipot et al. (2016) [PDF].
What is the difference between drifter ID numbers and World Meteorological Organization (WMO) numbers?
WMO numbers are used when the data is transmitted on the Global Telecommunications System for weather forecasting models, and in the past were reused. Drifter ID numbers are unique to each drifter and are not reused.
How and when are WMO numbers assigned?
WMO numbers are assigned after the deployment region is identified. WMO numbers are seven digit numbers used to reference data placed onto the Global Telecommunication System (GTS), for public distribution and archive. The first two digits of the WMO number correspond to the deployment region, which can be found on the map below.
Where do you find a WMO number for a particular drifter?
WMO numbers can be found in two places.
- If you already know the ID number of your particular drifter(s), please utilize the table found at:
aoml.noaa.gov/phod/dac/wmoid. - To find drifters within a specific region, or timeframe, please reference the GDP Directory File, at:
aoml.noaa.gov/phod/dac/dirall.
-
- The WMO number is shown in the second column, immediately to the right of the corresponding ID number.
Whom to contact with more specific questions about drifter data?
- If you have specific questions about drifter data that you cannot find within the GDP website, or within these FAQs, please contact Shaun Dolk.
- To contact another member of the GDP, please visit the “Who we are” section at the top of the page.
Where do I find drifter data and how much does it cost?
- Happily, the drifter data is FREE and accessible to the public, courtesy of NOAA’s Climate Program Office!
- Drifter data are quality controlled and stored at AOML’s Drifter Data Assembly Center, then sent to Canada’s Marine Environmental Data Service for archiving and public distribution.
- For links and instructions to access real-time drifter data, please visit
aoml.noaa.gov/phod/gdp/real-time_data - For quality controlled interpolated drifter data, please visit
aoml.noaa.gov/phod/gdp/interpolated/data/all.
Where do I find real-time drifter data?
- Links and instructions to access real-time drifter data, can be found at aoml.noaa.gov/phod/gdp/real-time_data.
How do I search for drifter data at a specific time and/or location?
- To search for real-time drifter data by specific time and location, visit
aoml.noaa.gov/phod/gdp/real-time_data. - To search for interpolated data by specific time, location and/or ID #, visit
aoml.noaa.gov/phod/gdp/interpolated/data/all. - To download the entire hourly drifter dataset, visit
aoml.noaa.gov/phod/gdp/hourly_data.
How often is the quality-controlled drifter database updated?
- The quality controlled drifter data is updated every 2-3 months. Therefore quality controlled drifter data is available delayed mode, with notifications of these updates found at aoml.noaa.gov/phod/gdp.
How do I download the entire quality-controlled drifter database?
- Drifter data can be downloaded from ftp://ftp.aoml.noaa.gov/pub/phod/buoydata.
Where do I find metadata files, with details about the drifters?
- Several files containing different kinds of metadata information are available on the web:
From the GDP Home page, select Global Drifter Program at the top of the screen, then navigate to Metadata. From there, you will find several options to choose from. Direct links are found below:- Drifter Deployment Information:
aoml.noaa.gov/phod/dac/deployed - Quality Controlled Metadata:
aoml.noaa.gov/phod/dac/dirall - Drifter Death Probabilities:
aoml.noaa.gov/phod/dac/drifter_deaths
- Drifter Deployment Information:
Hardware metadata are available at:
- Drifter Specifications:
aoml.noaa.gov/phod/dac/Drifter_Specifications - Barometer Specifications:
aoml.noaa.gov/phod/dac/Barometer_Metadata - Drogue Specifications:
aoml.noaa.gov/phod/dac/Drogue_Specifications
What is oldest drifter data available?
- The Global Drifter Program was established in 1979. While it took several decades to develop the program and reach its current state, with roughly 31,200 transmissions per day, the first drifter to transmit data was deployed on February 14, 1979.
How do I determine if a drifter has lost its drogue? Why is this important?
Determining drogue presence is vitally important, as this component of the drifter is what allows researchers to measure ocean current velocities at 15 meters depth. Without the drogue, which is centered at 15m, wind plays a greater roll in transporting drifters.
For this reason, AOML’s Data Assembly Center spends a tremendous amount of time and resources to pinpoint exactly when, and where, each drifter loses its drogue.
While sensor failures are identified and listed within the quality controlled dataset, you can determine real-time sensor functionality by using the WMO number from a particular drifter and visiting meteo.shom.fr/qctools.
An example of a drifter that has lost its drogue is shown in the figure below. Notice, the amount of strain on the lower hull of the surface float decreases significantly after drogue loss. At the same time, the time to first fix (how long it takes to acquire a GPS location fix) decreases significantly because the drogue is no longer pulling the surface float underwater with each passing wave.

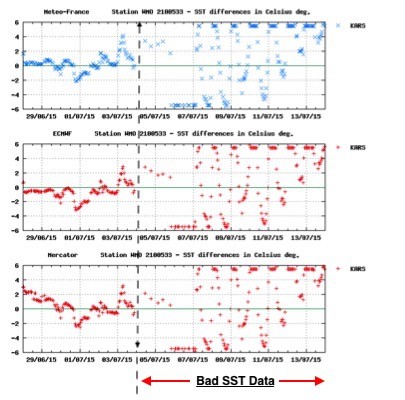
How do I determine if the sea surface temperature sensor has failed?
All drifters are equipped with a sea surface temperature sensor at the base of the surface float.
While sensor failures are identified and listed within the quality controlled dataset, you can determine real-time sensor functionality by using the WMO number from a particular drifter and visiting meteo.shom.fr/qctools.
An example of a failed sea surface temperature sensor is shown in the figure below. Notice, the structured diurnal pattern becomes erratic and irregular on Aug. 4th, 2015.
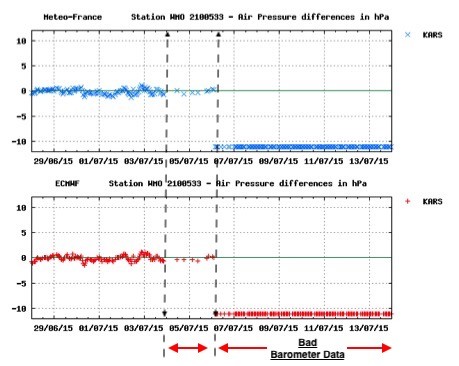
How do I determine if the barometric pressure sensor has failed?
While not all drifters are equipped with barometric pressure sensors, nearly half of the global drifter array measures sea-level pressure, which feeds into weather forecasting models.
While sensor failures are identified and listed within the quality controlled dataset, you can determine real-time sensor functionality by using the WMO number from a particular drifter and visiting meteo.shom.fr/qctools.
An example of a failed pressure sensor is shown in the figure below. Notice, the slight pressure fluctuations begin on August 4th, 2015, then the sensor experiences complete failure on August 6th, 2015.
Drifter Recovery
Did you find a drifter?
If you find a drifting buoy, please contact a member of the Global Drifter Program with the information listed on the surface float. If the drifter remains active, with functional batteries and operational sensors, we’ll attempt to have the drifter re-deployed. If the batteries and/or sensors are no longer operational, the drifter can be disposed of. Drifters contain no hazardous material, so simply dispose of the drifter as you would any other alkaline battery product.
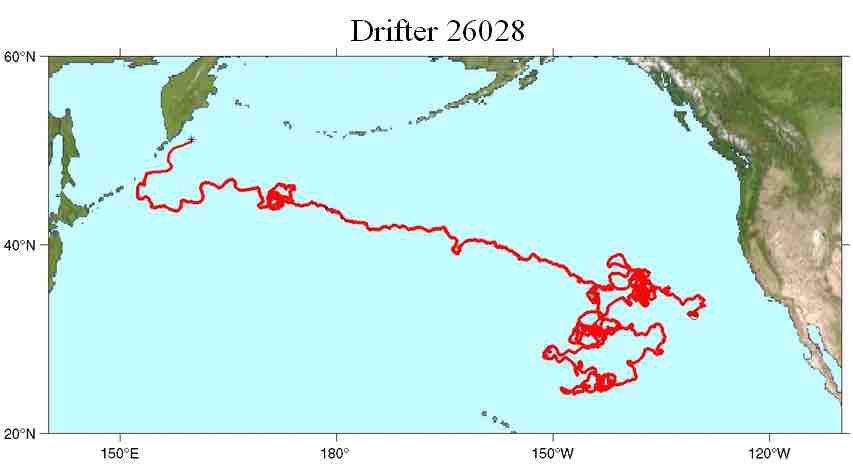
Drifter ID#26028
The longest lasting drifter on record transmitted for 10 years, 4 months, and 21 days.
10.3
YEARS
124
MONTHS
3792
DAYS
Drifter Bibliography
Our Contribution to Global Ocean Observing.
The following is a list of scientific publications that reference Global Drifter Program (GDP) data. If your drifter publication is not listed within, please email the Drifter Program with the complete reference.
Please contact publication authors to obtain an electronic or printed version of the articles. Alternatively, you may conduct a Google search of the publication title, which may direct you to an electronic version of the article.
Partners
Sharing Resources Delivers Results.
Expanding Reach Through Partnerships.
50+
Agencies
Agency & countries collaborating with AOML to deploy drifters for the Global Drifter Program
More Partners
Together with partners around the world, the GDP deploys nearly 1,000 drifters per year, throughout the world’s oceans. While not a complete list of GDP partners, below is a list of key contributors:
Argentina
Australia
Brazil
Canada
Chile
France
Institut Fracais de Recherche Pour I’exploitation de la Mer (IFREMER)
Gabon
Hong Kong
India
Indian National Center for Ocean Information Services (INCOIS)
Italy
Japan
Kenya
Republic of Korea
Mexico
New Zealand
South Africa
Spain
United Kingdom
United States
Massachusetts Maritime Academy (MMA)
NOAA National Data Buoy Center (NDBC)Office of Naval Research (ONR)
Oregon State UniversityNOAA Pacific Marine Environmental Laboratory (PMEL)
Scripps Institution of Oceanography
International Collaborators


