

AOML hurricane scientists were kept particularly busy this hurricane season with Hurricane Dorian, flying 15 P-3 missions over an 11-day period. This marks the most missions flown into a single storm since NOAA’s hurricane hunting missions began in 1975. The catastrophic, Category 5 storm will be long remembered as one of the Atlantic basin’s most powerful landfalling hurricanes. NOAA Hurricane Hunters measured Dorian’s intensification from a weak tropical storm in the Caribbean to one of the Atlantic’s fiercest hurricanes. The data they gathered were vital to protecting life and property, supporting NOAA’s efforts to warn vulnerable communities of approaching severe weather through accurate forecasts.

On August 24th, Dorian developed as a tropical storm southeast of the Lesser Antilles. What was once a poorly-organized system, Dorian slowly strengthened as it made its way across the Caribbean Sea and moved into the western Atlantic, entering a region of low wind shear and warm ocean temperatures which would allow the storm to further intensify.
Into the Eye of the Storm: Tracking Dorian’s intensification
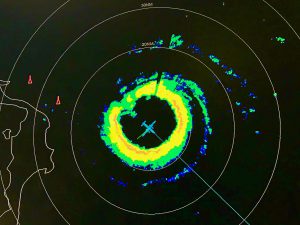
Airborne missions to sample Dorian began on August 26. Using instruments and technology aboard NOAA’s Hurricane Hunter P-3 aircraft, AOML hurricane scientists gathered observations from Dorian’s inner core to assess changes in the storm’s structure and intensity. Additional missions were conducted by NOAA’s Gulfstream-IV jet to sample the regions above and around the perimeter of Dorian to monitor how atmospheric currents impacted the storm’s movement.
Tail Doppler radar analyses combined with wind speed measurements remotely sensed from a special radiometer on the aircraft’s belly allowed AOML’s hurricane scientists to pinpoint Dorian’s strongest winds, how far they extended outward, and the regions of heaviest rainfall. Dropsondes deployed along the flight track provided critical information about the atmosphere such as pressure, temperature, and humidity. These data were transmitted in real-time into NOAA’s operational models, and used by the National Hurricane Center to generate up-to-date track and intensity forecasts. They were also incorporated into AOML’s experimental Basin-scale Hurricane Weather Research and Forecasting model (HWRF-B), which can forecast multiple storms occurring at the same time.
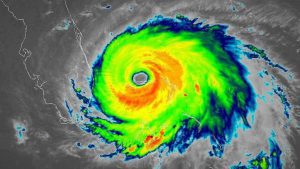
Devastated by Dorian: The storm makes land-fall in the Bahamas
On September 1st, Dorian made landfall over the Abaco Islands in the Bahamas. Missions aboard the P-3 continued making several passes through the eyewall measuring peak sustained wind speeds of 185 mph and gusts greater than 200 mph. After landfall along Grand Bahama Island, Dorian’f forward speed slowed to a crawl before completely stalling due to a collapse of the steering currents. For more than 48 hours the region was battered by Dorinan’s ferocious winds and a 20+ foot storm surge that caused severe widespread flooding. The catastrophic storm’s extreme economic and human impacts to the Bahamas will be long lasting, as communities struggle to recover from the devastation.
Missions ended on September 5 as Dorian gradually weakened and swept up the U.S. eastern seaboard. After passing over Cape Hatteras, Dorian headed out to sea, accelerating toward the Canadian Maritimes, making one last landfall near Halifax, Nova Scotia as a post-tropical storm before finally dissipating.