Real-time Doppler Radar
Analyzing & Delivering Airborne Doppler Radar Data in Real-Time
JUMP TO DATA
OR SCROLL TO LEARN MORE
Who We Are


This project is also currently supported by collaborations with the Aircraft Operations Center (OMAO), Sonia Otero (OMAO), and Stephanie Stevenson (NHC).
Background
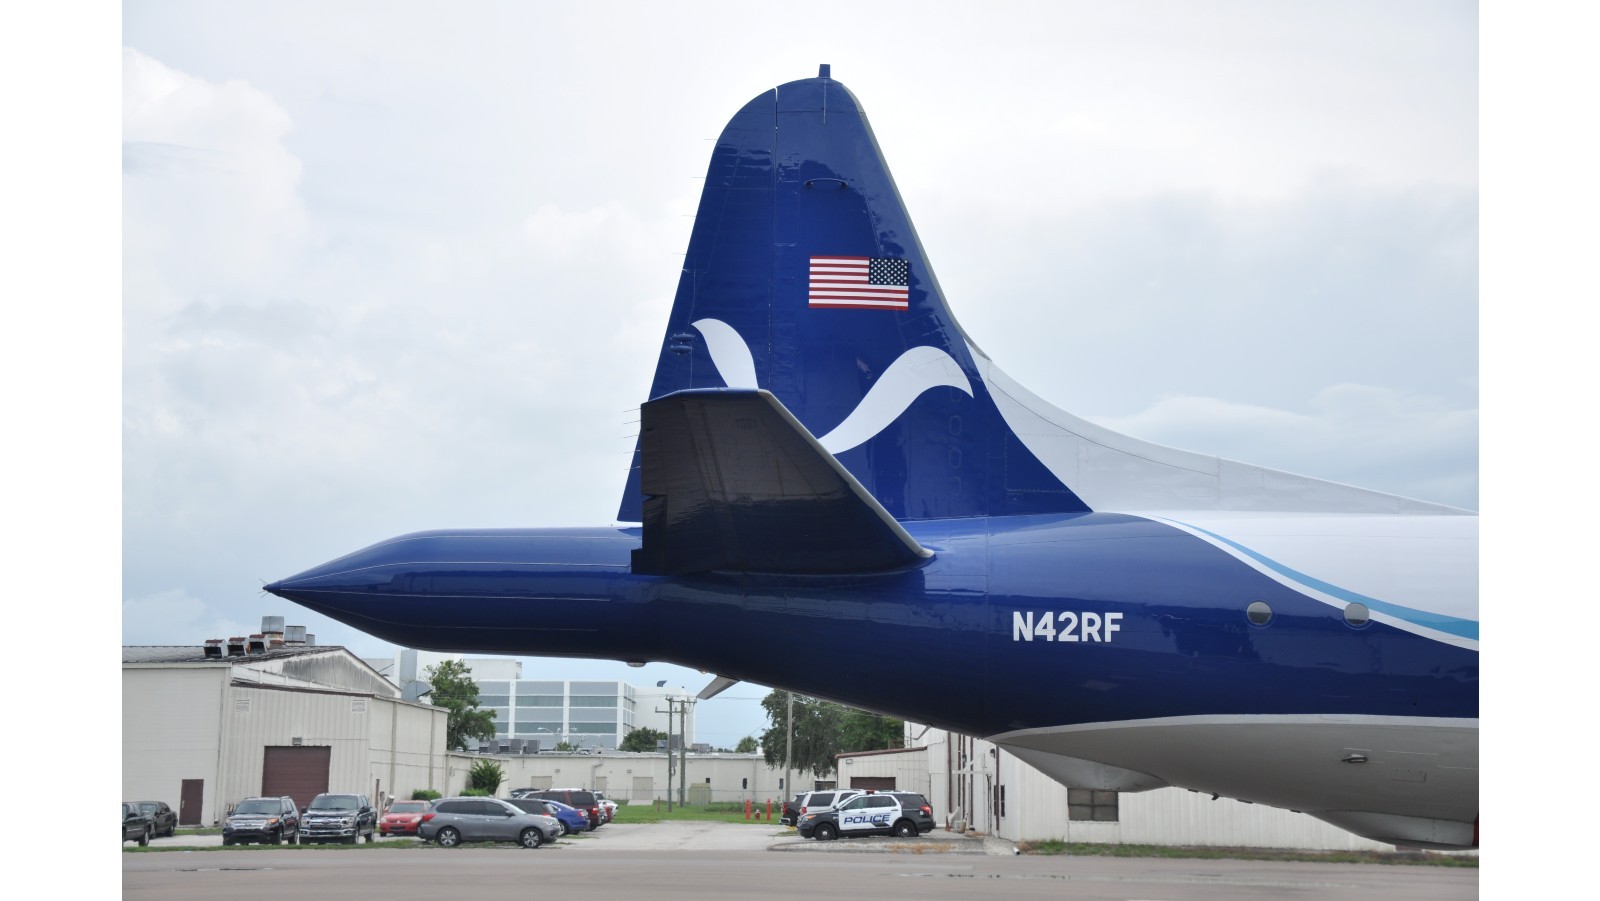
Tail Doppler Radar
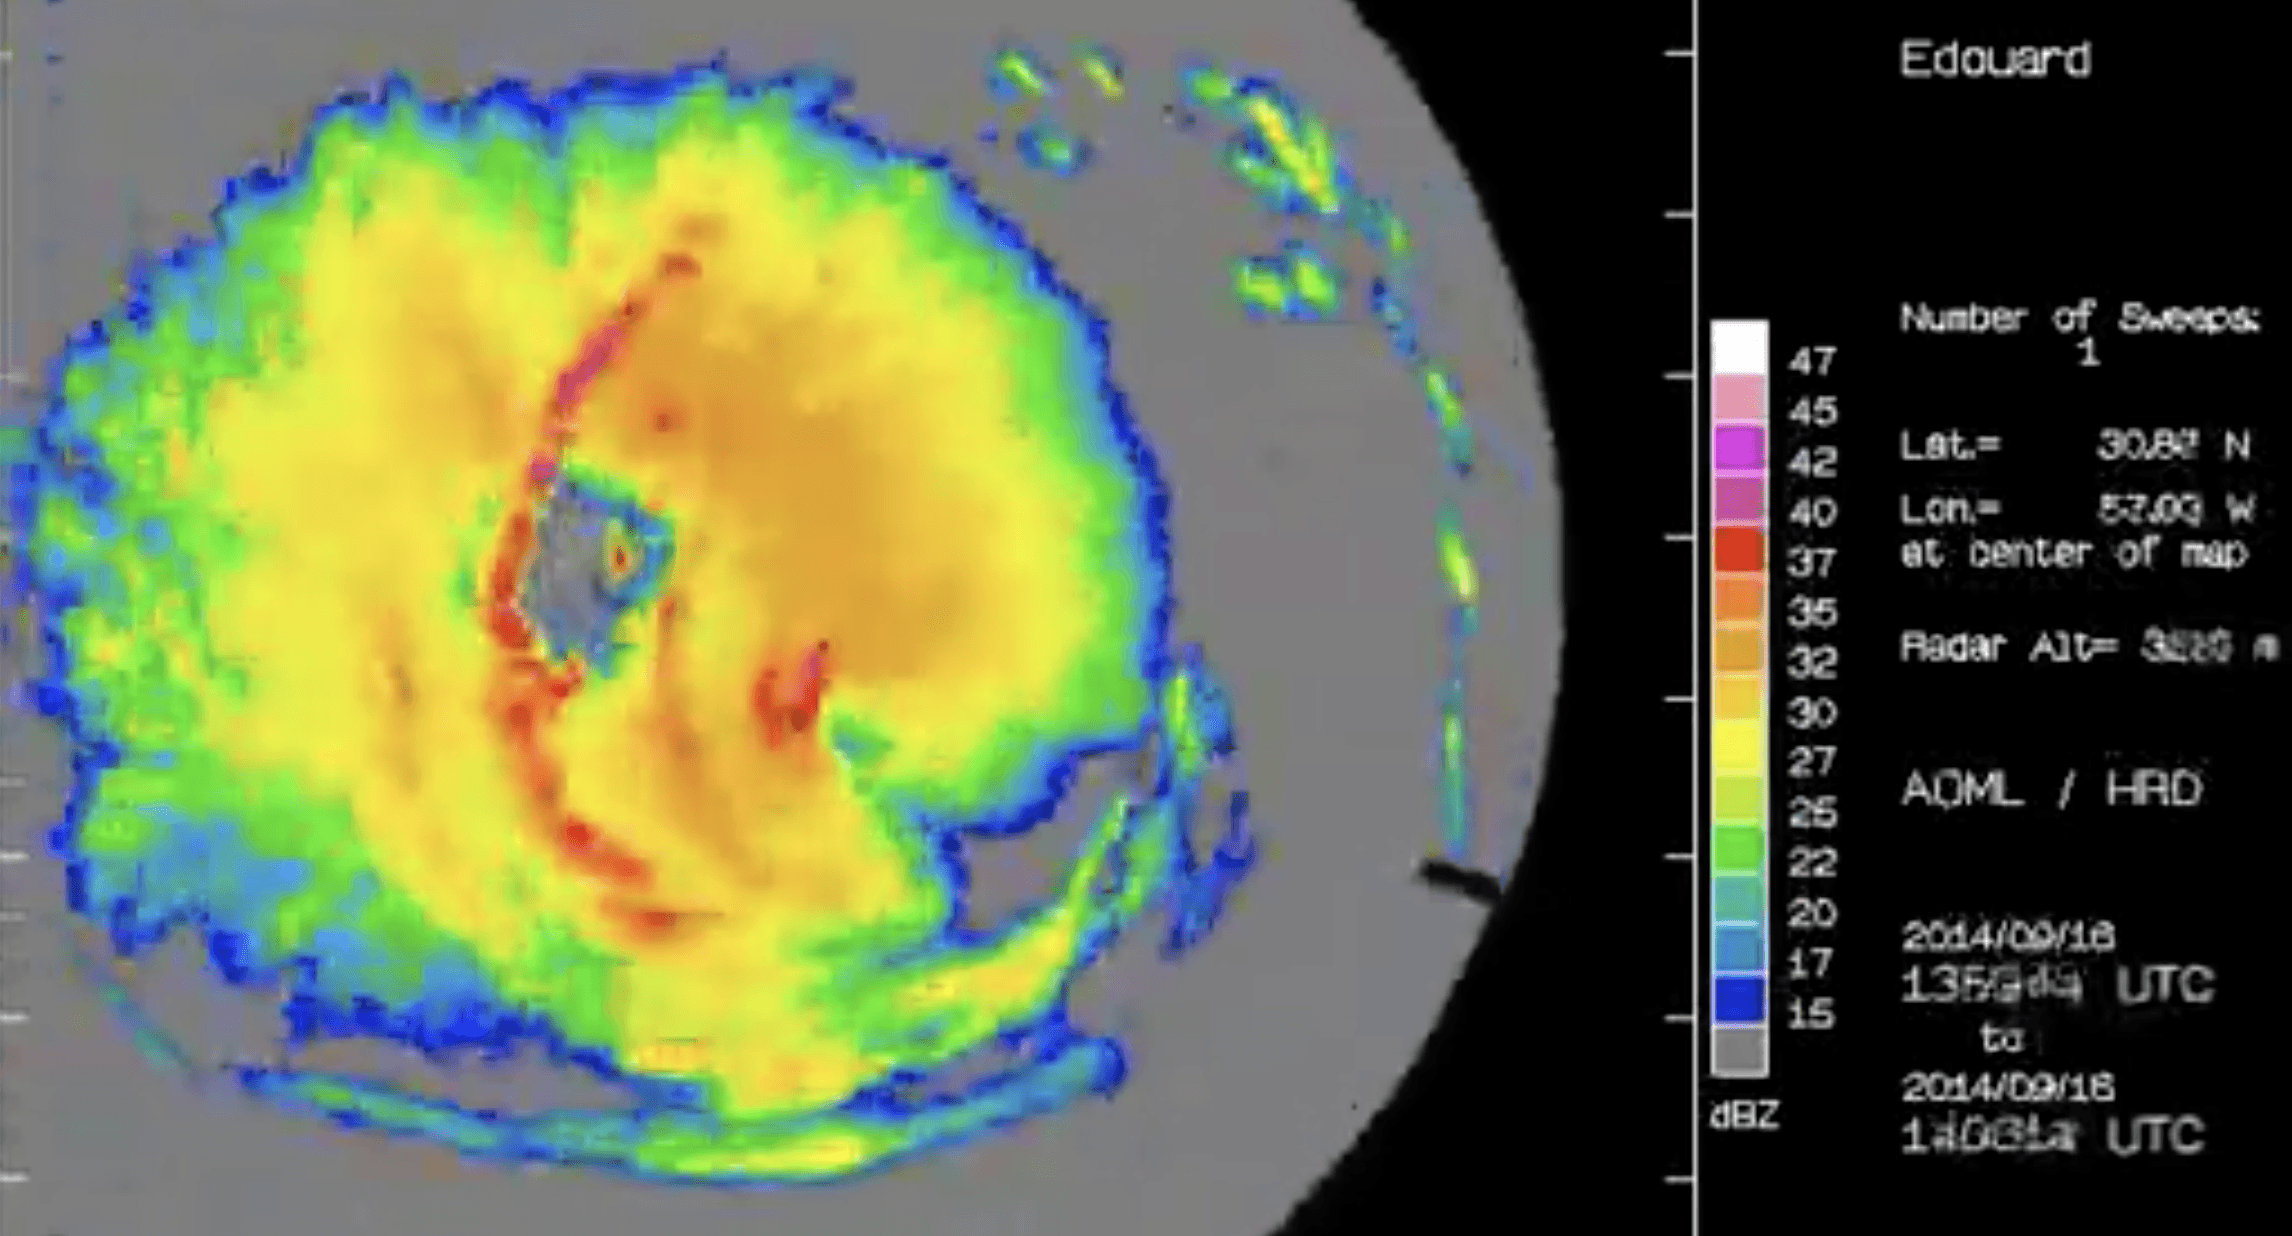
Tail Doppler Radar (TDR): The Tail Doppler Radar system is located at the back end of the aircraft. As the plane flies through a storm, the TDR continuously measures near-vertical cross-sections of precipitation and winds. By piecing together all of these cross-sections, scientists are then able to create a three-dimensional image of the storm. This three-dimensional “CAT scan” can show where the strongest winds are, how far the strong winds extend out from the storm center, and where the most intense rainfall occurs.
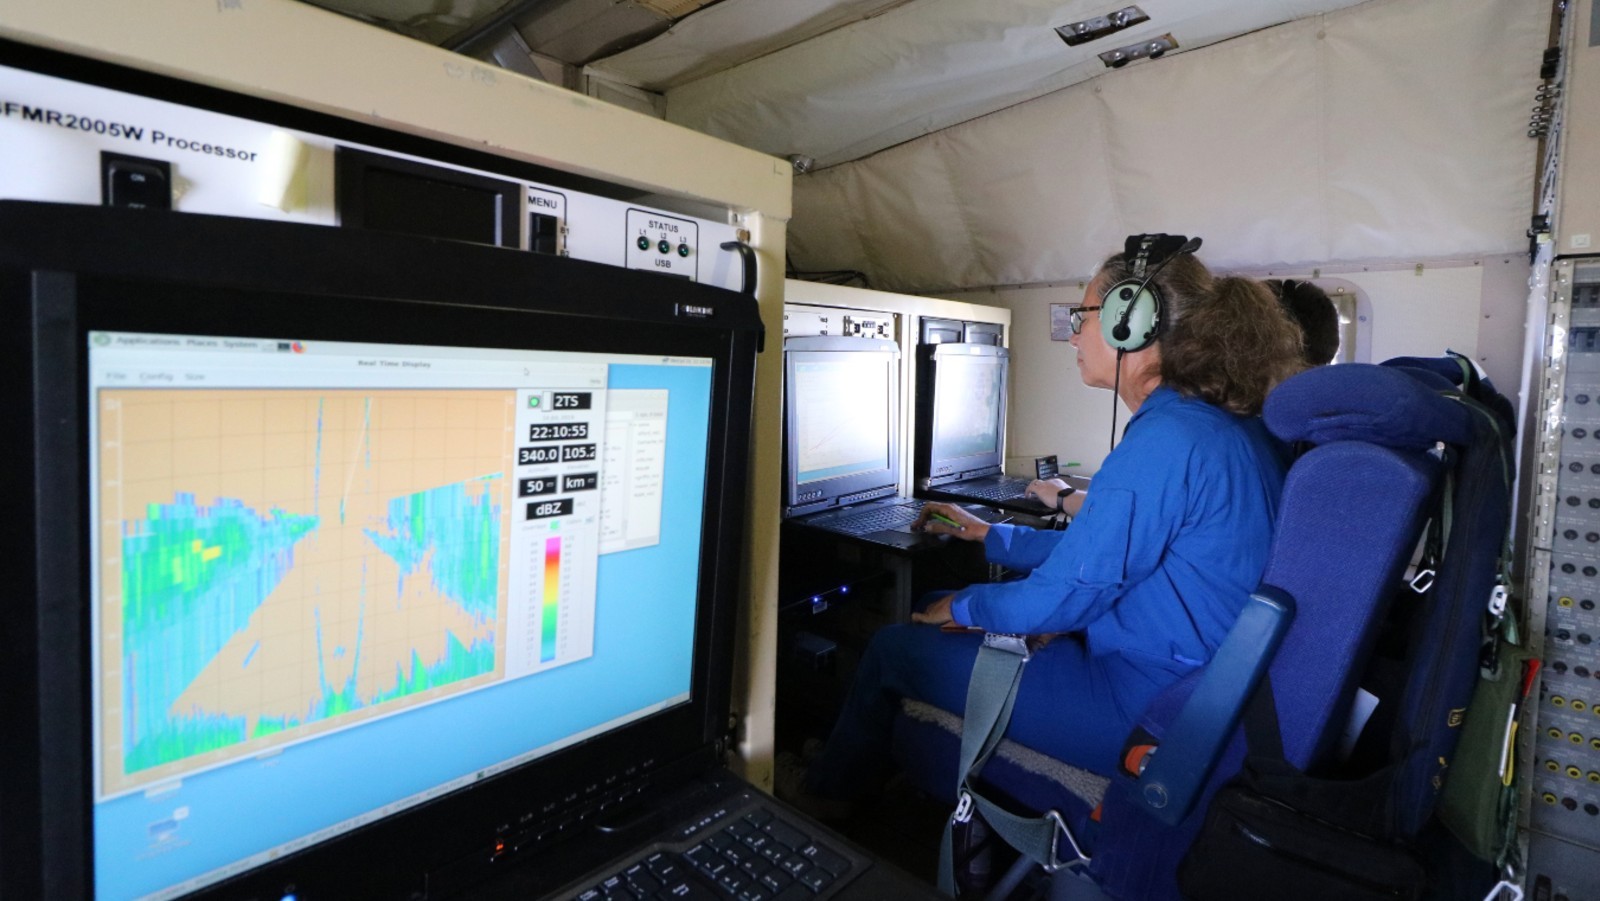
Lower Fuselage (LF) Radar:
The LF Radar system is located on the belly of the aircraft. It scans horizontally, much like an ordinary Doppler radar system would on the ground, and provides scientists with a high-time-resolution view of the swirling winds and precipitation near the altitude of the aircraft.
The Quality-Control Process
In order to make the Tail Doppler Radar data useful in real-time, we developed an algorithm that automates the data quality-control process. In addition to effectively removing noise from the data, the algorithm properly interprets the Doppler wind measurements along the radar beam. Prior to the final development of this algorithm in 2005, the Tail Doppler Radar data had to be manually quality controlled by scientists, restricting its use primarily to research studies well after the hurricane season.
The automation of this quality-control process opens the doors to more timely research applications. It expands use of the Tail Doppler Radar data for all collaborators, and its use in real-time to enhance the guidance available to forecasters responsible for assessing the potential hurricane threats.
Key Accomplishments
Operational assimilation of Doppler Radar data from NOAA P-3s
September 2013
First assimilation of quality-controlled P-3 Doppler Radar data into experimental Hurricane Weather Research and Forecasting model
October 2010
First successful transmission of superobs and assimilation into non-operational research model (WRF-ARW) in real-time
August 2008
Hurricane Katrina: First real-time transmission to National Hurricane Center of real-time Doppler wind analyses done onboard the NOAA P-3 aircraft
August 2005
Ground-based hurricane wind fields from single Doppler Radar
September 1998
Vertically Scanning Doppler Radar
August 1996
Transmission of airborne radar reflectivity images and Doppler wind fields from within the hurricane
September 1993
Sampling Methods
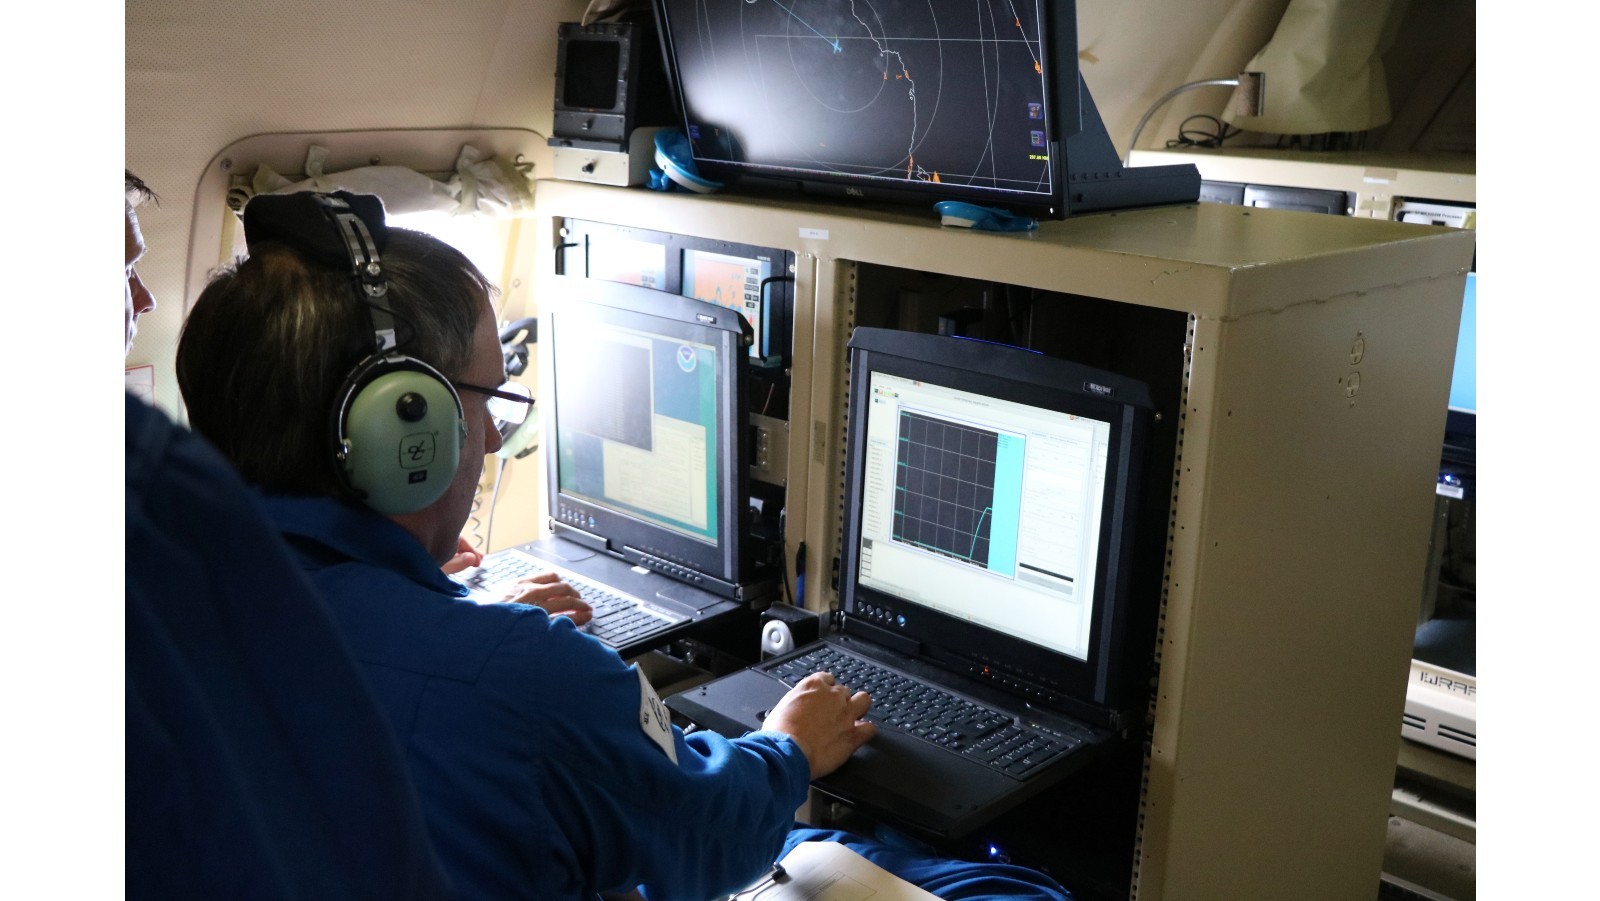
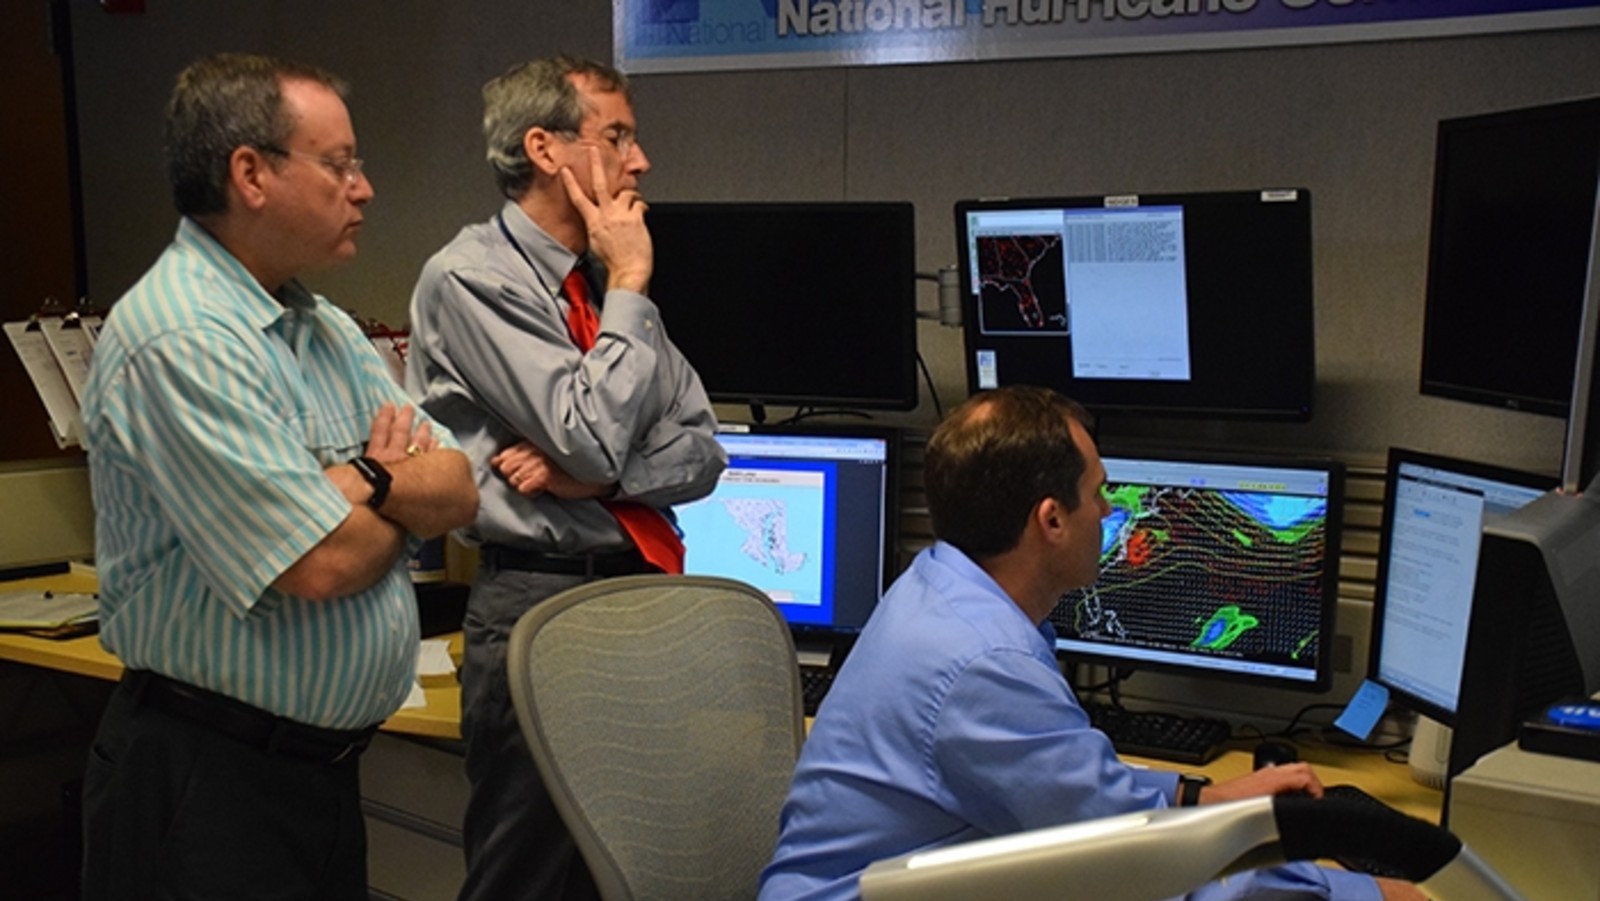
We gather airborne Doppler-radar wind and precipitation measurements from the P-3 and G-IV aircraft, quality control the data on the aircraft, and then deliver it to our National Weather Service partners in real-time. The quality-controlled data sent to the Environmental Modeling Center contributes to an accurate initialization of the Hurricane Weather Research and Forecasting model required for detailed forecasts of storm structure, intensity, and track.
The three-dimensional Tail Doppler Radar images of the storm and high-time-resolution Lower Fuselage Radar views of precipitation are sent directly to the National Hurricane Center and other local weather forecast offices. We also make these real-time radar products available to hurricane researchers within NOAA and across the globe to increase understanding of the processes at work within hurricanes.

Goals
Impacts
Community Impact
Ultimately, by refining data analyses through quality-control methods, the National Hurricane Center can use the Hurricane Weather Research and Forecasting model to keep the community up-to-date and well informed during a hurricane. The protection of life and property is of the utmost importance during any extreme weather event, and AOML is able to serve the community by constantly collecting the most recent Doppler Radar data in real-time.
Scientific Impact
Over the past 30 years, improvements in Doppler radar technology have made substantial contributions to meteorologists’ key understanding of hurricane data. The development of this real-time, quality-controlled technology for Doppler data analysis is crucial to scientists and has made headway for new research projects aimed at improving the accuracy and quality of the data that these modernized instruments and tools collect.
Featured Publication

Barron, N. R., Didlake Jr, A. C., & Reasor, P. D. (2022). Statistical Analysis of Convective Updrafts in Tropical Cyclone Rainbands Observed by Airborne Doppler Radar. Journal of Geophysical Research: Atmospheres, 127(6), e2021JD035718.4
Abstract: Ten years of airborne Doppler radar observations are used to study convective updrafts’ kinematic and reflectivity structures in tropical cyclone (TC) rainbands. An automated algorithm is developed to identify the strongest rainband updrafts across 12 hurricane-strength TCs. The selected updrafts are then collectively analyzed by their frequency, radius, azimuthal location (relative to the 200–850 hPa environmental wind shear), structural characteristics, and secondary circulation (radial/vertical) flow pattern. Rainband updrafts become deeper and stronger with increasing radius. A wavenumber-1 asymmetry arises, showing that in the downshear (upshear) quadrants of the TC, updrafts are more (less) frequent and deeper (shallower)…
Statistical Analysis of Convective Updrafts in Tropical Cyclone Rainbands Observed by Airborne Doppler Radar
Barron, N. R., Didlake Jr, A. C., & Reasor, P. D. (2022). Statistical Analysis of Convective Updrafts in Tropical Cyclone Rainbands Observed by Airborne Doppler Radar. Journal of Geophysical Research: Atmospheres, 127(6), e2021JD035718.4
Abstract: Ten years of airborne Doppler radar observations are used to study convective updrafts’ kinematic and reflectivity structures in tropical cyclone (TC) rainbands. An automated algorithm is developed to identify the strongest rainband updrafts across 12 hurricane-strength TCs. The selected updrafts are then collectively analyzed by their frequency, radius, azimuthal location (relative to the 200–850 hPa environmental wind shear), structural characteristics, and secondary circulation (radial/vertical) flow pattern. Rainband updrafts become deeper and stronger with increasing radius. A wavenumber-1 asymmetry arises, showing that in the downshear (upshear) quadrants of the TC, updrafts are more (less) frequent and deeper (shallower)…

Publications & References
Wadler, J.B., R.F. Rogers, and P.D. Reasor. The relationship between spatial variations in the structure of convective bursts and tropical cyclone intensification using airborne Doppler radar. Monthly Weather Review, 146(3):761-780, doi:10.1175/MWR-D-17-0213.1 2018Lorsolo, S., J. Gamache, and A. Aksoy. Evaluation of the Hurricane Research Division Doppler radar analysis software using synthetic data. Journal of Atmospheric and Oceanic Technology, 30(6):1055-1071, doi:10.1175/JTECH-D-12-00161.1 2013
Reasor, P., R. Rogers, and S. Lorsolo. Environmental flow impacts on tropical cyclone structure diagnosed from airborne Doppler radar composites. Monthly Weather Review, 141(9):2949-2969,doi:10.1175/MWR-D-12-00334.1 2013
Rogers, R., S. Lorsolo, P. Reasor, J. Gamache, and F.D. Marks, 2012: “Multiscale analysis of mature tropical cyclone structure from airborne Doppler composites,” Monthly Weather Review, 140 (1), P. 77-99 (January 2012)
Lorsolo, S., F.D. Marks, J.F. Gamache, and J.A. Zhang, 2010: “Estimation and mapping of hurricane turbulent energy using airborne Doppler measurements.” Monthly Weather Review, 138(9)p.3656-3670 (September 2010)
Nuissier, O., R.F. Rogers, and F.Roux, 2005: “A numerical simulation of Hurricane Bret on 22-23 August 1999 initialized with airborne Doppler radar and dropsonde data” Quar.Jour.Roy.Met.Soc., 131 (605) p.155-194 (Jan. 2005)
Harasti,P.R., McAdie,C.J., Dodge, P.P., Lee, W-C, Tuttle, J., Murillo, S.T., Marks, F.D., 2004: “Real-Time Implementation of Single-Doppler Radar Analysis Methods for Tropical Cyclones: Algorithm Improvements and Use with WSR-88D Display Data,” Weather and Forecasting 19(2) 219-239 (February 2004)
Looking for Literature? Search our Publication Database.