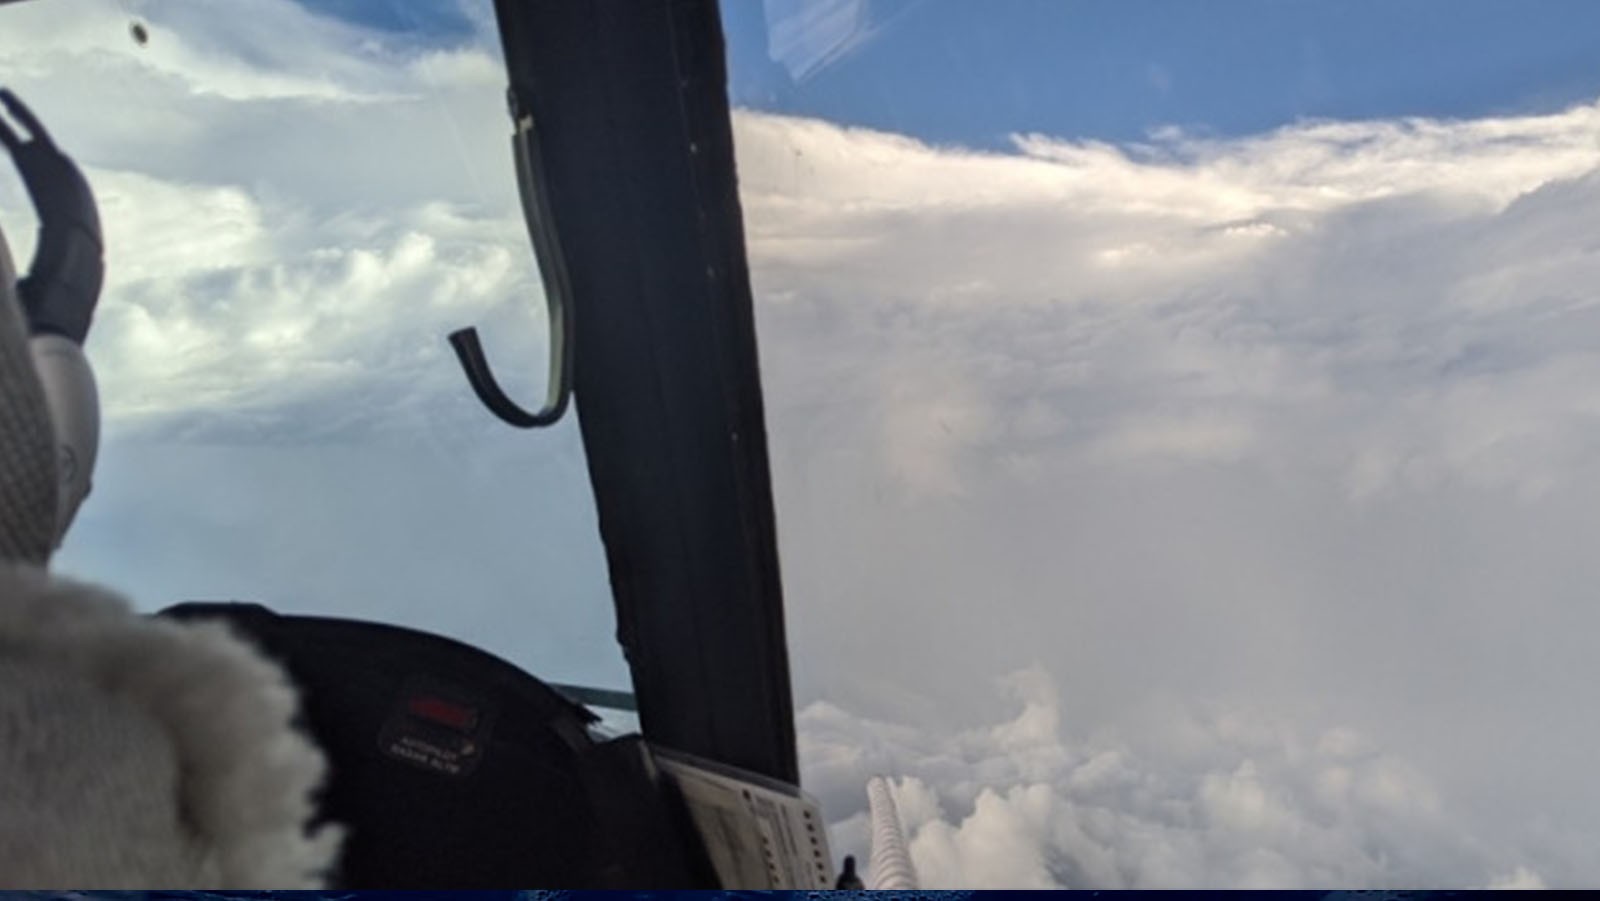

NOAA’s P-3 aircraft returned to Lakeland, FL at 1 AM EDT on August 27th from its final mission to close out the National Hurricane Center and Environmental Modeling Center tasked reconnaissance into major Hurricane Laura.
AOML hurricane scientists coordinated with ground crews stationed in the path of Laura’s trajectory to obtain valuable measurements that captured the structural evolution of major Hurricane Laura upon landfall, while successfully completing all operational mission objectives.
The system made landfall at 1 AM EDT on August 27th near Cameron, LA with a central pressure of 938 mb and 150 mph sustained surface winds.
The Lake Charles National Weather Service local office evacuated prior to landfall, now noting extensive damage to their land-based radar tower. Reports continue to emerge regarding the scope of destruction left within the wake of the system.
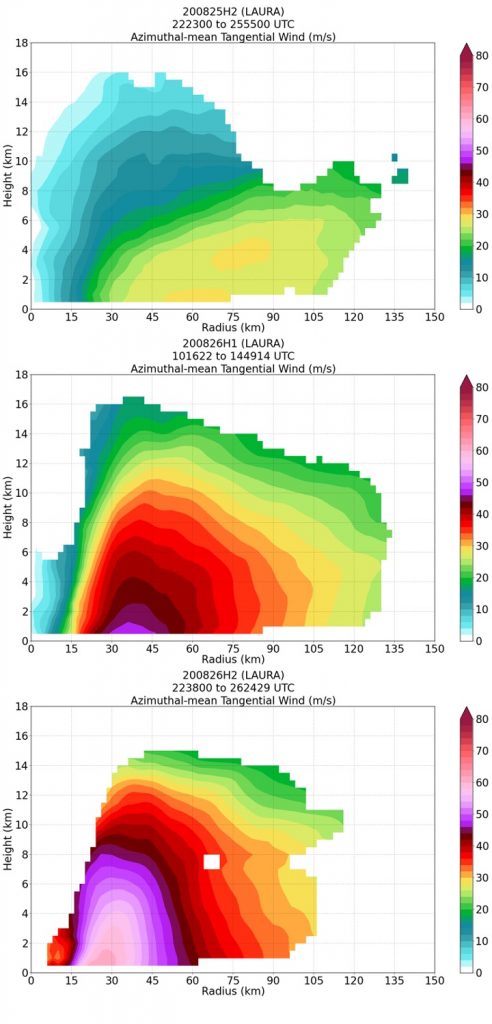
As Laura’s center approached the Texas/Louisiana border, AOML scientists determined that the system’s broad circulation expanded during its very formidable rapid intensification in the Gulf of America.
Major Hurricane Laura exhibited extreme persistent winds at the surface that extended far from the eyewall, consistent with increasing reports of substantial wind damage in Louisiana.
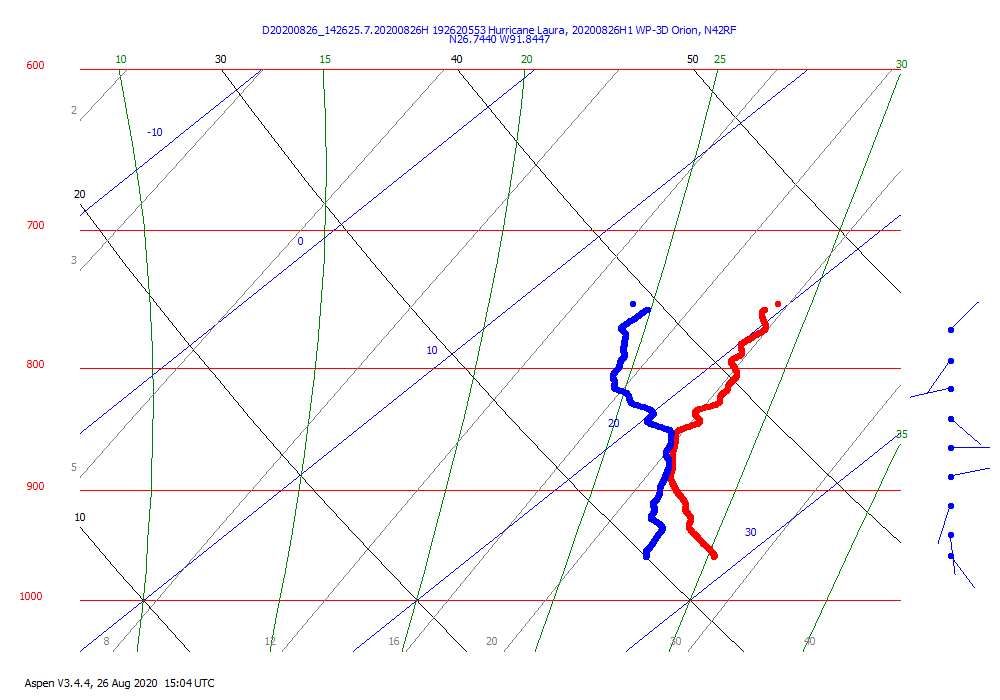
Dropsonde environmental soundings throughout the day showed a classic, well defined hurricane structure, and confirmed 155 mph winds at an altitude of just 250 feet at 7 PM on August 26th. This measurement verified conditions in the eyewall as observed by onboard Stepped Frequency Microwave Radiometer and Tail Doppler Radar instrumentation.
AOML’s Hurricane Research Division will continue with daily forecast discussions to prepare for potential tropical cyclone development. Scientists plan to debrief from this reconnaissance tasking next week.
For the latest information about tropical cyclones and other weather systems, visit the NOAA National Weather Service National Hurricane Center.
For information on numerical prediction of tropical cyclones, visit the NOAA National Centers for Environmental Prediction Environmental Modeling Center.