
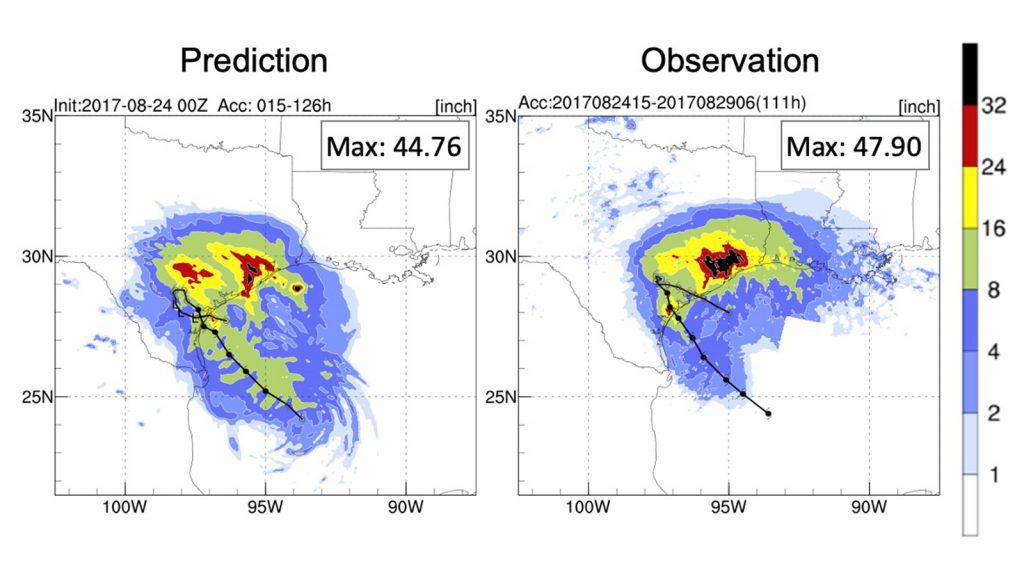
A recent study published in the journal Atmosphere evaluated for the first time, how well NOAA’s regional hurricane model was able to forecast the location and amount of devastating rainfall in 2017’s Hurricane Harvey. The Hurricane Weather Research and Forecasting (HWRF) model predicted the realistic total rainfall and the location of the maximum rainfall of Hurricane Harvey, which were the most devastating impacts of the storm’s landfall in coastal Texas.
“The most promising results showed that after running the model 20 times with different initial conditions, we discovered that the model could forecast the locations of the heaviest rainfall five days before the event,” said Mu-Chieh Ko, a hurricane researcher with the University of Miami and lead author on the study.
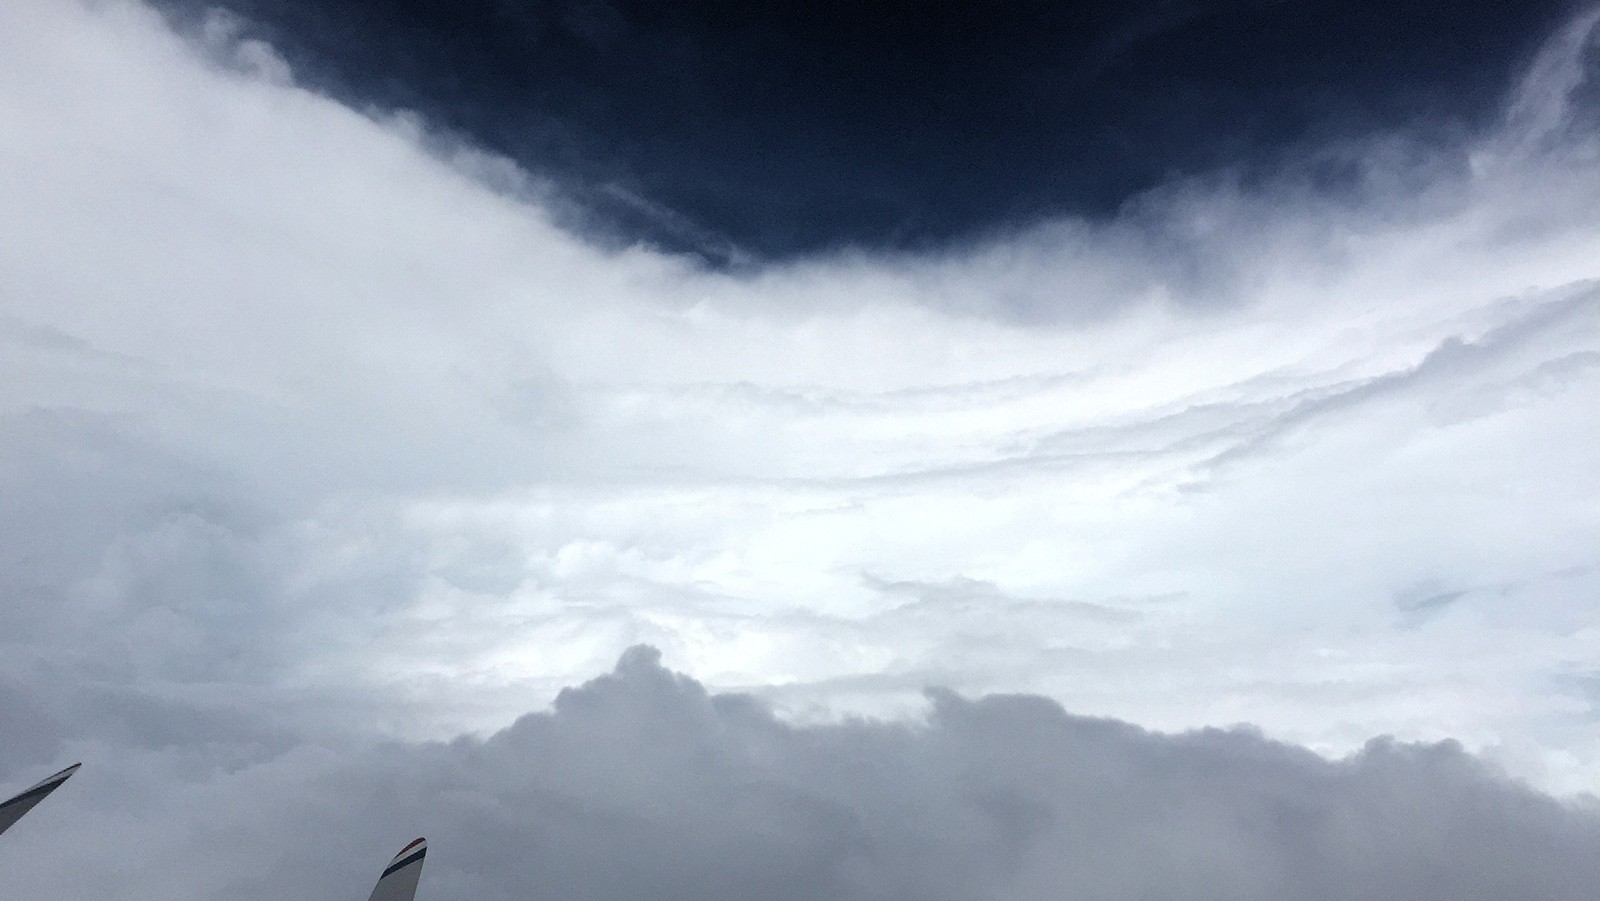
Hurricane Harvey brought up to five feet of rainfall to Texas and Louisiana in five days. Its rainfall was located far away from the center, or eye, of the storm. This is unusual as the strongest rainfall typically occurs near the eye of a hurricane. Unusual events make it difficult for forecast models to correctly predict rainfall when hurricanes or tropical storms make landfall.
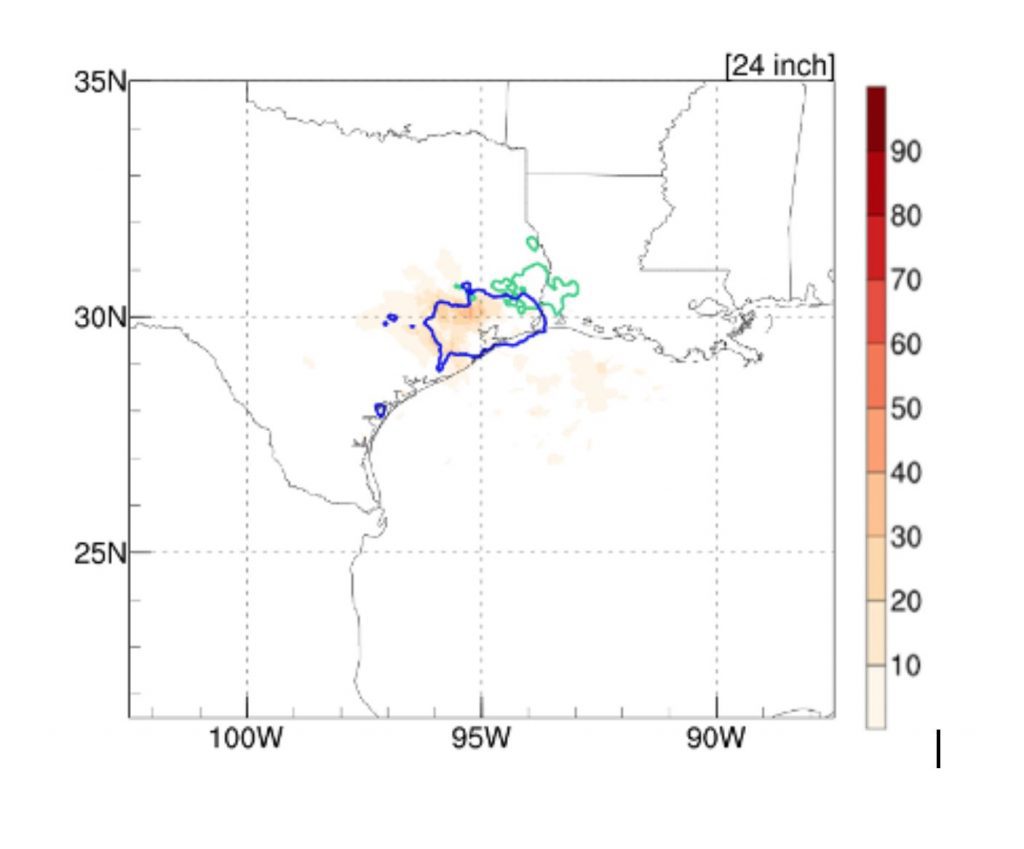
This study aimed to understand how forecast models perform during such rare events. The study tested two versions of NOAA’s HWRF model, which is developed by AOML and NOAA’s Environmental Modeling Center . This study shows the potential of using the HWRF model as an effective rainfall forecasting tool, which could be useful for real-time hurricane prediction, flood forecasting, or disaster management.
The methods used to evaluate the HWRF model in this study will be useful when applied to other models and storms.
AOML Contributors: Mu-Chieh Ko (CIMAS), Frank D. Marks, Ghassan J. Alaka Jr., Sundararaman G. Gopalakrishnan