
From its onset to the decay, El Niño-Southern Oscillation (ENSO) plays an important role in forcing climate variability around the globe. A new study led by Sang-Ki Lee, a PhOD/CIMAS scientist, provides an efficient approach to explore the differences in the evolution of space-time patterns of sea surface temperature observed during El Niño events.
El Niño-Southern Oscillation (ENSO), from its onset to the decay, plays very important roles in forcing climate variability around the globe associated with the East Asian monsoon, tropical cyclones, terrestrial rainfalls and extra-tropical extreme weather events. Although much has been learned about the underlying mechanisms driving ENSO, it is still a difficult task to accurately forecast its seasonal evolution because there exists considerable irregularity in its onset and decay timing, amplitude and spatial structure.
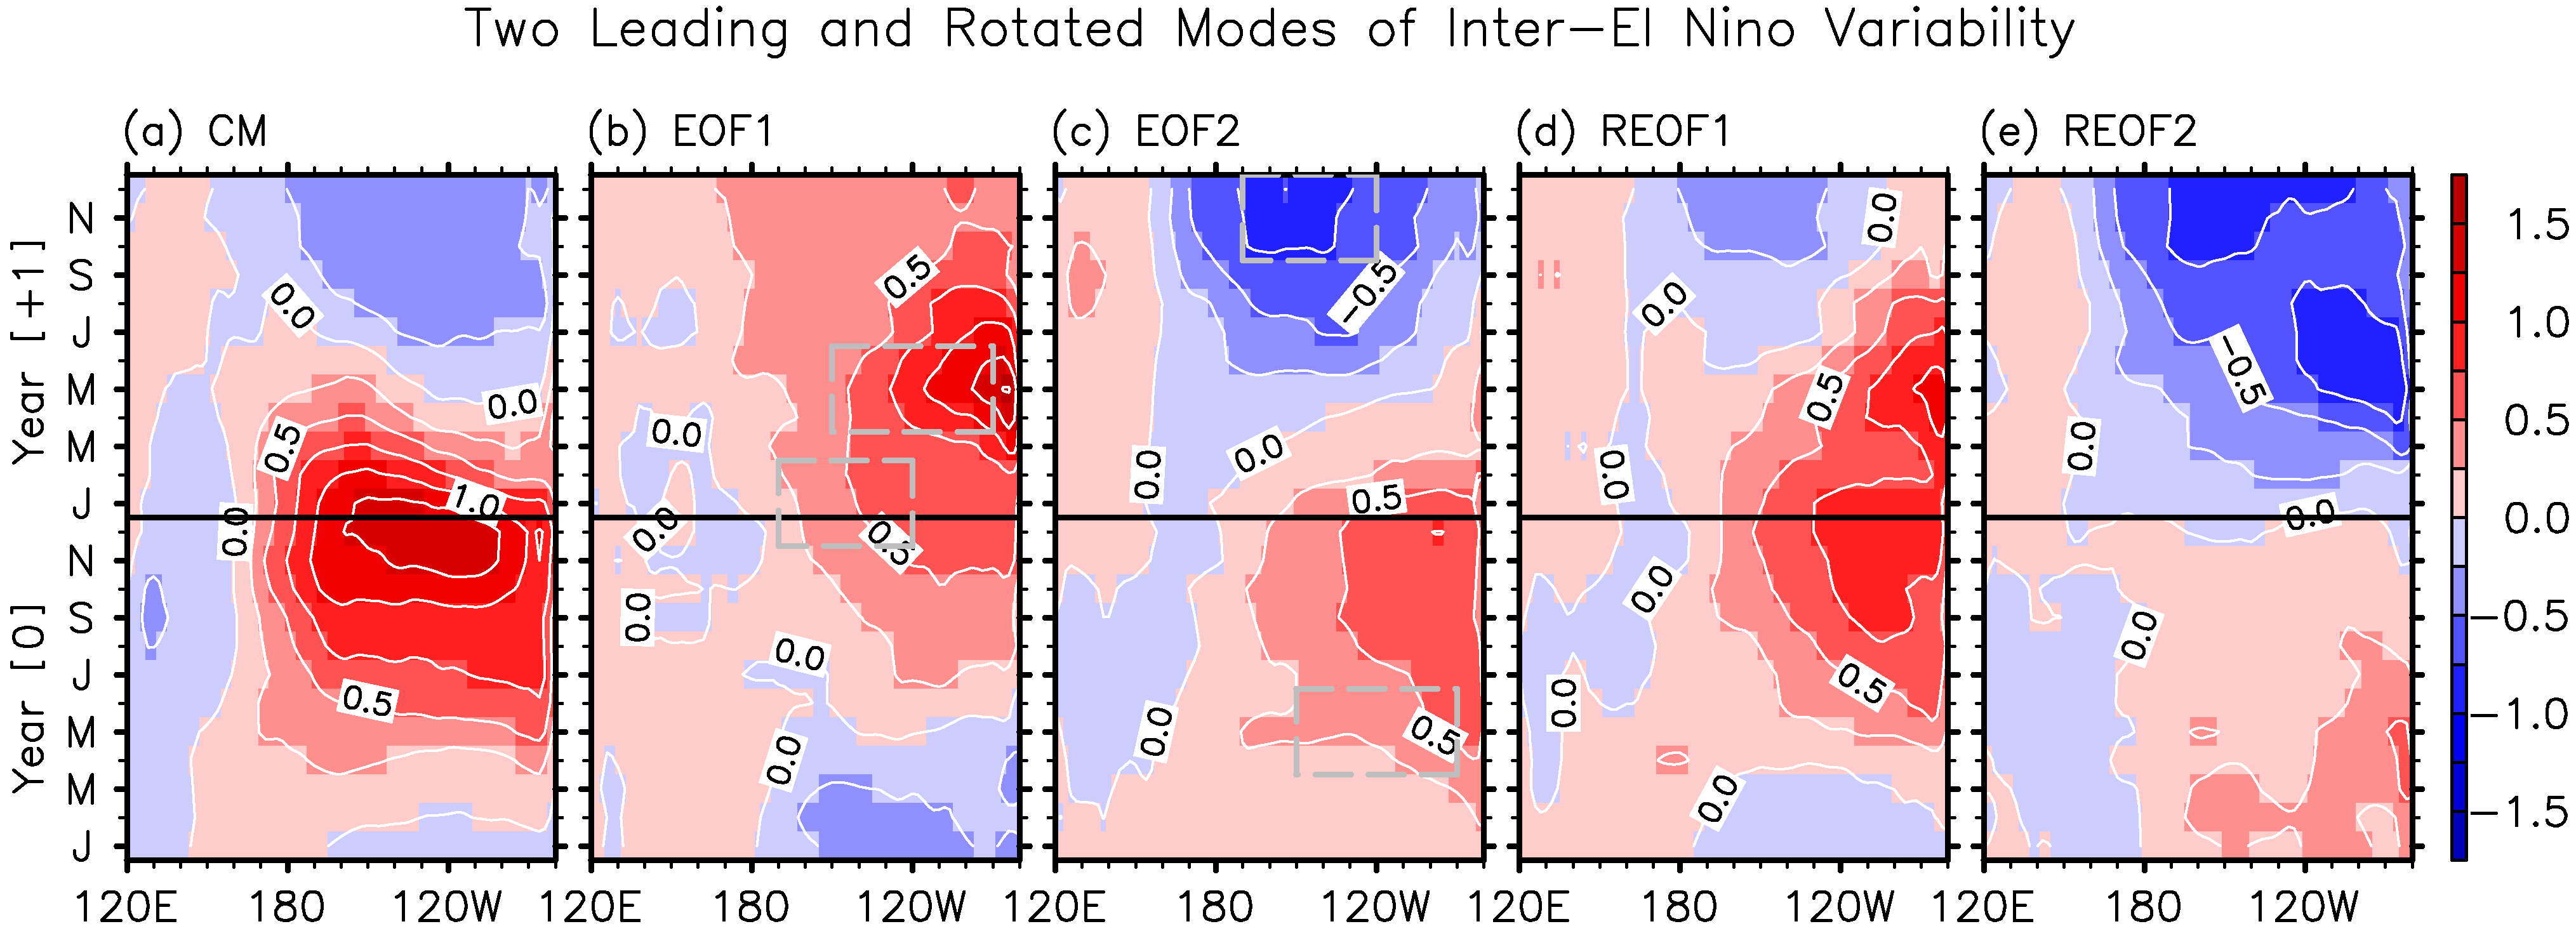
In a research article recently published online in the Geophysical Research Letters, a team of scientists led by Dr. Sang-Ki Lee, a PhOD/CIMAS scientist, presented a new approach to explore the differences in the evolution of space-time patterns of sea surface temperature (SST) observed during the onset, peak and decay phases of El Niño events. The inter-El Niño variability is captured by two leading modes (Figure 1), which explain more than 60% of the inter-event variance.
The first mode illustrates the extent to which abnormally warm SST in the eastern tropical Pacific (EP) persist into the northern spring after the peak of El Niño. The analysis suggests that a strong El Niño event tends to persist into the spring in the EP, whereas a weak El Niño favors a rapid development of abnormally cold sea surface temperature in the EP shortly after its peak.
The second mode captures the transition and resurgence of El Niño in the following year. An early-onset El Niño tends to favor a transition to La Niña, a phenomena with below-average SST across the central and eastern equatorial Pacific. A late-onset El Niño, on the other hand, tends to persist long enough to produce another El Niño event.
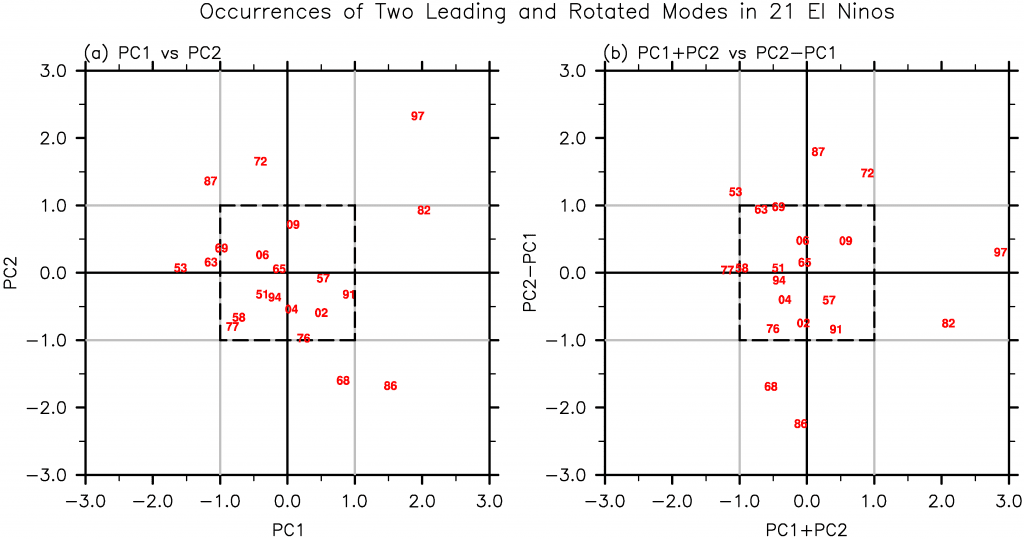
The evolution of several El Niño events during 1949-2013 can be efficiently summarized in terms of these two modes (Figure 2), which are not mutually exclusive, but exhibit distinctive coupled atmosphere-ocean dynamics.
Lee, S.-K. P. N. DiNezio, E.-S. Chung, S.-W. Yeh, A. T. Wittenberg, and C. Wang, 2015: Spring persistence, transition and resurgence of El Nino. Geophys. Res. Lett., doi:10.1002/2014GL062484. Image Credit: NOAA AOML.