
AOML XBT Network
Longest Time Series in Existence Used to Measure Ocean Properties
JUMP TO DATA OR SCROLL TO LEARN MORE
Who We Are
What We Do
The NOAA/AOML XBT (eXpendable BathyThermograph) Network consists of transects across all ocean basins where XBT are used to collect temperature observations of the upper 1km of the ocean. The XBTs are deployed from research vessels, including the ships of the Ship Of Opportunity Program (SOOP).
The transects are sampled in two modes: High Density and Frequently Repeated. All XBT transects are reviewed through an international consortium with oversight by the SOOP Implementation Panel (SOOPIP). Several XBT transects are providing some of the longest time series in existence used to monitor ocean properties.
Objectives of the XBT Network
- Monitor changes of key surface and subsurface currents, to study meridional heat transport in all ocean basins, and to supplement other observational platforms to assess the variability of the upper ocean heat content.
- Provide critical input for weather and climate forecasts models and scientific applications.
- Conduct temperature profile observations in US shelf waters in support of hurricane research and forecasts, and
- Provide together with other observational platforms assessments of the variability of the global upper ocean heat content.

| Zach Barton
Shipping logistics, Equipment Maintenance, Ship Rider

| Sandra Bringas
Web Maintenance, MHT Products

| Shenfu Dong, PhD
Co-Principal Investigator

| Marlos Goes, PhD
Research

| Caridad Gonzalez
AMVERSEAS, Quality Control Data

| Jay Harris
IT Specialist

| Hosmay Lopez, PhD
Co-Principal Investigator

| Pedro Pena
Engineer

| Isabel Porto, PhD
Web Maintenance

| Kandaga Pujiana, PhD
Research

| Christian Saiz
Engineer, Ship Rider

| Andrew Stefanick
Engineer

| Joaquin Trinanes, PhD
Ocean Observations Viewer, Data management
Top News
Voyage of collaboration: The XBT Network and the Ship Of Opportunity Program
August 20, 2024
Scientists and engineers at NOAA/AOML frequently participate in cruises in support of the NOAA/AOML eXpendable BathyThermograph (XBT) Network. Recently, Dr. Marlos Goes, a University of Miami CIMAS scientist, gave a short talk to the officers of the Vienna Express, a vessel from the Hapag-LLoyd company, about the importance of the Ship Of Opportunity Program (SOOP) […]


Read More News
Research Impacts & Key Findings
On average, approximately 12,000 eXpendable BathyThermographs (XBT’s) are deployed per year, of which NOAA/AOML is involved in some aspect of the logistics, operations, data processing, of about 80% of them.
Background
Introduction
The Ship Of Opportunity Program (SOOP) is an international effort that supports the implementation of a network of cargo vessels, cruise ships, and research vessels to deploy scientific instruments that collect oceanographic observations. The most important component of this effort is the NOAA/AOML eXpendable BathyThermograph (XBT) network. These XBT temperature measurements are used to monitor changes of key surface and subsurface currents, to study meridional heat transport in all ocean basins, and to supplement other observational platforms to assess the variability of the upper ocean heat content. All XBT transects have been justified based on our understanding of how the upper ocean dynamics and thermal structure may be linked to long-term climate signals, extreme weather events, ecosystem assessments, etc.
What is a XBT?
An eXpendable BathyThermograph (XBT) is a probe that is deployed from a ship and measures the temperature as it falls through the water. A very thin wire transmits the temperature data to the ship where it is recorded for later analysis. The probe is designed to fall at a known rate, so that the depth of the probe can be inferred from the time since it was launched. After deployment, data collected from XBTs are transmitted in real-time to data distribution centers (e.g. The Global Telecommunication System and NOAA/NCEI) and these data are used for scientific analysis and for assimilation in numerical ocean, weather, climate, and ecosystem models. The earliest XBT observations date from the 1950’s and more than 2 million XBTs have been deployed to-date.
What is the XBT Network?
XBTs are mostly deployed along fixed routes that are referred to as “transects”. There are 49 XBT transects recommended by the scientific community in High Density and Frequently Repeated modes. High Density transects are occupied at least 4 times per year and XBTs are deployed at approximately 25 km intervals along the ship track. Frequently repeated transects are occupied approximately 18 times per year with XBT deployments at 100 km intervals. Several XBT transects have been occupied for more than 30 years.
The XBT network is very complex to maintain and a strong collaboration between many organizations and countries is needed. The unique contribution provided by XBTs cannot be accomplished by any other single observational platform. However, there is a strong synergy between XBT observations and observations from other platforms, such as altimetry, surface drifters, Argo, etc.
How do XBT’s measure depth?
XBTs do not measure depth directly (e.g. using a pressure sensor). Instead, fall-rate equations are used to derive the depth of the XBT as a function of time after the XBT is deployed into the ocean:
where z(t) is the depth of the XBT in meters, and a, b are constants determined using theoretical and empirical methods for each XBT probe model. For more information about the XBT fall rate equation and coefficients, please check the XBT bibliography.
Why are XBT’s valuable?
XBTs are valuable because they:
- Represent the largest fraction of the temperature profile observations since 1970s and until the implementation of Argo profiling floats in approximately 2007.
- In recent years, 16,000 to 20,000 XBT are deployed each year, of which around 15,000 are distributed globally in real-time, representing close to 15% of the current total upper ocean thermal profile observations.
- Measure the seasonal and inter-annual fluctuations in the transport of mass, heat, and freshwater across transects, which define large enclosed ocean areas.
- Determine the long-term mean, seasonal cycle, and inter-annual fluctuations of temperature, geostrophic velocity and large-scale ocean circulation in the top 800 m of the ocean.
- Provide long time-series of temperature profiles at approximately repeated locations in order to unambiguously separate temporal from spatial variability.
- Determine the space-time variability of temperature and geostrophic shear fields.
- Provide appropriate in situ data (together with Argo profiling floats, tropical moorings, air-sea flux measurements, sea level etc.) for testing ocean and ocean-atmosphere models.
XBT Transects

The NOAA/AOML XBT (eXpendable BathyThermograph) Network is designed to measure the upper ocean thermal structure with the objective of investigating the temporal variability of key global surface and subsurface currents and of meridional heat transport in the Atlantic Ocean. XBT transects in HD mode are repeated approximately every three months with XBTs deployed 10km to 35km apart, in order to measure the mesoscale structure of the ocean and to assess the ocean circulation responsible for redistributing heat and other water properties globally. HD XBT transects are carried out globally with AOML taking the lead in most of the operations in the Atlantic Ocean. In order to accomplish all operations, from instrument development, probe deployments, and data management, AOML works with academic and government institutions in Argentina, Australia, Brazil, China, France, Germany, Italy, Japan, South Africa, and England. There are approximately 30 active XBT transects worldwide.
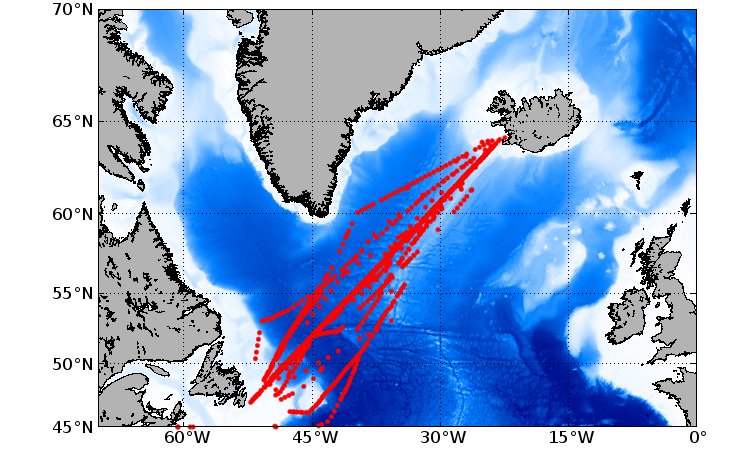
XBT (eXpendable BathyThermographs) transect AX01 runs between Greenland, Iceland, and Denmark. It is located across the northward upper transport to the Nordic Seas and Arctic Ocean and provides the data necessary to monitor the subpolar gyre. The data is also used to study ocean current transport on seasonal time scales and to perform comparisons between an intake temperature sensor (Thermosalinograph, installed in the ships used for these transects) and the XBTs, in order to assess possible temperature biases. Additionally data from AX01 helps to document the ocean heat storage and global transport of heat and fresh water, which is crucial to improving climate prediction models that are initialized with temperature profiles. The seasonal to interannual variability in upper ocean heat content and transport is monitored to understand how the ocean responds to changes in atmospheric and oceanic conditions and how the ocean response may feedback to the important climate fluctuations such as the North Atlantic Oscillation.
Implemented in 2000 in collaboration with French Institut de Recherche pour le Developpement(IRD) and the University of Paris.
Average drops: 28
XBT (eXpendable BathyThermographs) transect AX02 runs from Iceland to Canada. Transect AX02 is located across the northward upper transport to the Nordic Seas and Arctic Ocean and provides the data necessary to monitor the subpolar gyre. The data is also used to study ocean current transport on seasonal time scales and to perform comparisons between an intake temperature sensor (Thermosalinograph, installed in the ships used for these transects) and the XBTs, in order to assess possible temperature biases. Additionally data from AX02 helps to document the ocean heat storage and global transport of heat and fresh water, which is crucial to improving climate prediction models that are initialized with temperature profiles. The seasonal to interannual variability in upper ocean heat content and transport is monitored to understand how the ocean responds to changes in atmospheric and oceanic conditions and how the ocean response may feedback to the important climate fluctuations such as the North Atlantic Oscillation.
Implemented in 2008 in collaboration with French Institut de Recherche pour le Developpement(IRD) and the University of Paris.
Average drops: 49
XBT (eXpendable BathyThermographs) transect AX04 is located nominally along 38oN extending from Straits of Gibraltar to the NE US coast at New York, NY. This latitude is ideal for monitoring heat flux variability in the Atlantic because it lies near the center of the subtropical gyre, which has been shown to be the latitude of the maximum poleward heat flux in the Atlantic Ocean.
Implemented in 2020 using commercial vessels.
Average drops: 44
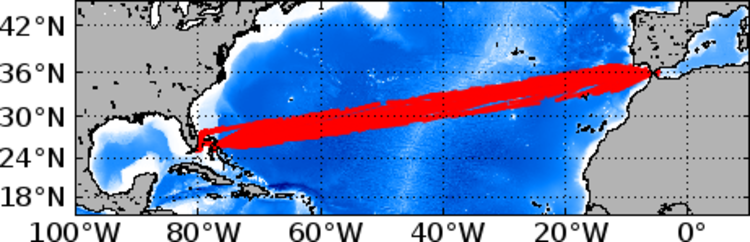
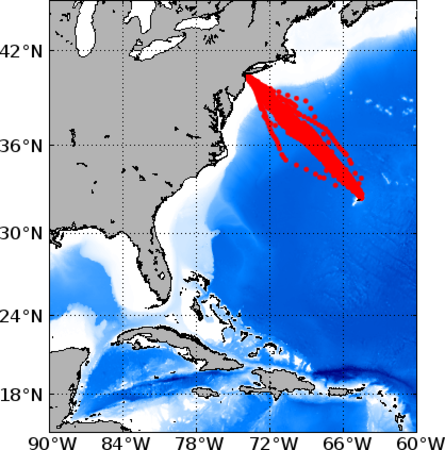
XBT (eXpendable BathyThermographs) transect AX07 is located nominally along 30oN extending from the Straits of Gibraltar in the eastern Atlantic to the east coast of the United States at Miami, Florida. This latitude is ideal for monitoring heat flux variability in the Atlantic because it lies near the center of the subtropical gyre, which has been shown to be the latitude of the maximum poleward heat flux in the Atlantic Ocean.
Implemented in 1994 using commercial vessels.
Average drops: 232
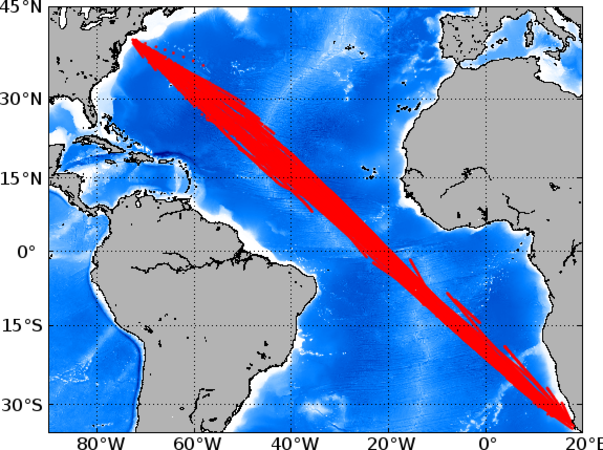
XBT (eXpendable BathyThermographs) transect AX08, a component of the Tropical Atlantic Observing System, crosses the tropical Atlantic in a NW-SE direction between North America and South Africa, specifically from Cape Town South Africa to Newark, NJ United States. Historical data along AX08 and other historical temperature observations in the tropics exhibit decadal and multi-decadal signals. It has been hypothesized that this large time scale signal may cause atmospheric variability. Given the importance of the tropical Atlantic in climate variability, and the scarcity of observations in this region, data obtained from the measurements along this transect are key to improving our understanding of the ocean and our ability to forecast climate. Temperature profiles obtained from this transect will help to monitor the main zonal currents, countercurrents and undercurrents in the tropical Atlantic and to investigate their spatial and temporal variability.
Implemented in 2000 using commercial vessels.
Average drops: 362
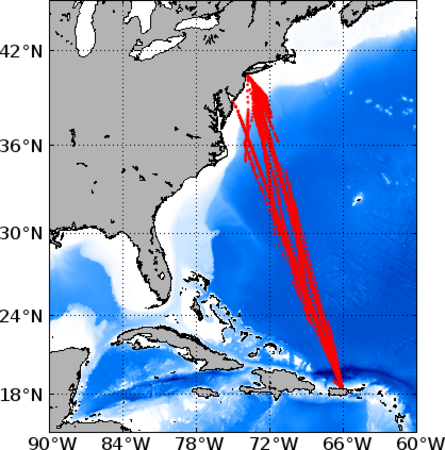
XBT (eXpendable BathyThermographs) transect AX10 is located between New York City and Puerto Rico. This line closes off the United States eastern seaboard, where subtropical temperature anomalies could have the greatest interaction with the atmosphere. This transect was chosen to monitor the location of the Gulf Stream and its link to the North Atlantic Oscillation.
Implemented in 1996 using commercial vessels.
Average drops: 102
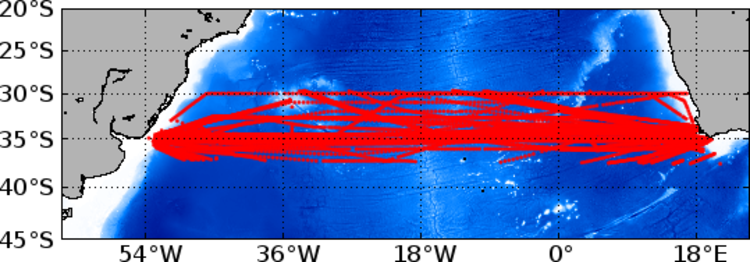
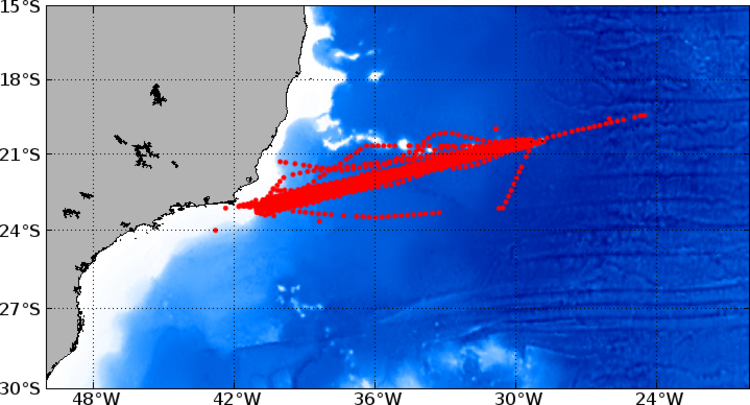
XBT (eXpendable BathyThermographs) transect AX18, which runs between Cape Town and South America (Montevideo, Uruguay, or Buenos Aires, Argentina) is geared towards improving the current climate observing system in the South Atlantic, a region of poor data coverage. The goal of AX18 is to monitor the meridional mass and heat transport in the upper 800 m across 30oS. Given the importance of the South Atlantic and the scarcity of observations in this region, data obtained from the measurements along this transect will be used to investigate the role of the South Atlantic in improving climate forecasts.
Implemented in 2002 using commercial vessels.
Average drops: 217
XBT (eXpendable BathyThermographs) transect AX20 runs from Spain to French Guyana. The provided data helps to document the ocean heat storage and global transport of heat and fresh water, which is crucial to improving climate prediction models that are initialized with temperature profiles. The seasonal to interannual variability in upper ocean heat content and transport is monitored to understand how the ocean responds to changes in atmospheric and oceanic conditions and how the ocean response may feedback to the important climate fluctuations such as the North Atlantic Oscillation.
Implemented in 2011 in collaboration with French Institut de Recherche pour le Developpement(IRD) and the University of Paris.
Average drops: 163
XBT (eXpendable BathyThermographs) transect AX25 was implemented to monitor the variability in the upper layer interocean exchanges between South Africa and Antarctica on seasonal and interannual time scales. In addition, by exploiting the relationship between upper ocean temperature and dynamic height, XBTs are used to infer velocities and to monitor the various frontal locations in the region.
Implemented in 2004 in collaboration with Univ. of Cape Town.
Average drops: 128
XBT (eXpendable BathyThermographs) transect AX32 runs between Newark, New Jersey United States and Bermuda. It has been designed and implemented to monitor the cross-shelf temperature structure.
Implemented in 2017 in collaboration with University of Rhode Island.
Average drops: 20
XBT (eXpendable BathyThermographs) transect AX90 has been designed and implemented to monitor the surface-to-bottom temperature of all water between Scotland and Iceland.
Implemented in 2013.
Average drops: 19
XBT (eXpendable BathyThermographs) transect AXCOAST collects observations taken on the continental shelf off the east US coast from Miami to New York, where temperature profile observations are generally non-existent, in support of monitoring changes in water mass properties and upper ocean thermal structure for hurricane research and forecasts.
Implemented in 2020 using commercial vessels.
Average drops: 20
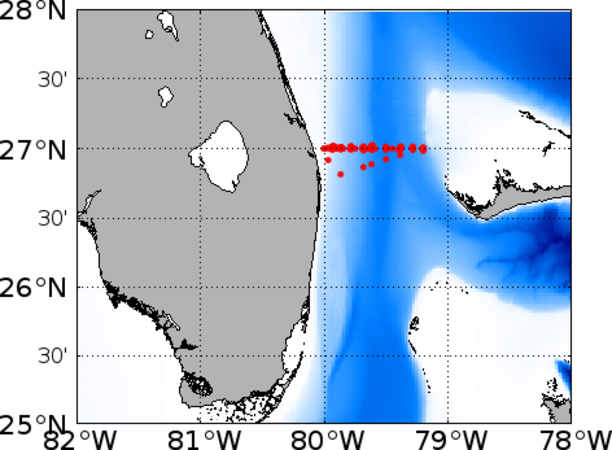
XBT (eXpendable BathyThermographs) transect AXWBTS is located between Florida (West Palm Beach) and the Bahamas (near Eight-Mile Rock). This line is part of the Western Boundary Time Series project that has measured the strength of the Florida Current since 1982. This transect was chosen to monitor the location of the Florida Current (further upstream this current is called the Gulf Stream) and is related to the international program that measures the strength of the meridional overturning circulation and heat transport (see wbts).
Implemented in 2017 in collaboration with the Western Boundary Time Series project.
Average drops: 9
XBT (eXpendable BathyThermographs) transect MX01 cross along the warmer and saltier part of the Mediterranean Sea waters from Sicilia, Italy to Crete Island, where some permanent and transient structures and gyres can be observed and monitored with the XBT data. Several studies have located in that region unexpected changes and unexplained variability since the 80’s (for instance Malanotte-Rizzoli et al.,1999). The intrusion of seawater from eastern basin into western part is almost continuously monitored but not the region where such warm and salt water forms. In the past thirty years the traditional flow of water in the Mediterranean has been modified due to climate change: Mediterranean is still continuing to be warmer and saltier and the rise in sea level is accelerating in recent years. In the Mediterranean, reported temperature anomalies often locally translating into disruption of the wind regime, of the water mass stratification and of the thermocline depth, could in part be correlated with positive North Atlantic Oscillation.
Implemented in 2011 in collaboration with Agenzia Nazionale per le Nuove Tecnologie, l’Energia e lo Sviluppo Economico Sostenibile (ENEA).
XBT (eXpendable BathyThermographs) transect MX02 cross along the warmer and saltier part of the Mediterranean Sea waters from Nice, France to Straits of Gibraltar, where some permanent and transient structures and gyres can be observed and monitored with the XBT data. Several studies have located in that region unexpected changes and unexplained variability since the 80’s (for instance Malanotte-Rizzoli et al.,1999). The intrusion of seawater from eastern basin into western part is almost continuously monitored but not the region where such warm and salt water forms. In the past thirty years the traditional flow of water in the Mediterranean has been modified due to climate change: Mediterranean is still continuing to be warmer and saltier and the rise in sea level is accelerating in recent years. In the Mediterranean, reported temperature anomalies often locally translating into disruption of the wind regime, of the water mass stratification and of the thermocline depth, could in part be correlated with positive North Atlantic Oscillation.
Implemented in 2012 in collaboration with Agenzia Nazionale per le Nuove Tecnologie, l’Energia e lo Sviluppo Economico Sostenibile (ENEA).
XBT (eXpendable BathyThermographs) transect MX04 cross along the warmer and saltier part of the Mediterranean Sea waters from Genoa, Italy to Palermo, Italy, where some permanent and transient structures and gyres can be observed and monitored with the XBT data. Several studies have located in that region unexpected changes and unexplained variability since the 80’s (for instance Malanotte-Rizzoli et al.,1999). The intrusion of seawater from eastern basin into western part is almost continuously monitored but not the region where such warm and salt water forms. In the past thirty years the traditional flow of water in the Mediterranean has been modified due to climate change: Mediterranean is still continuing to be warmer and saltier and the rise in sea level is accelerating in recent years. In the Mediterranean, reported temperature anomalies often locally translating into disruption of the wind regime, of the water mass stratification and of the thermocline depth, could in part be correlated with positive North Atlantic Oscillation.
Implemented in 2011 in collaboration with Agenzia Nazionale per le Nuove Tecnologie, l’Energia e lo Sviluppo Economico Sostenibile (ENEA).
Temperature Section Analysis
The maps below display the location of all temperature profiles deployed along specified expendable bathythermograph transects, mean along-transect temperature sections and time their evolution at selected depths.


XBT Operations
Ocean Observations Viewer
AOML and NOAA CoastWatch host NOAA’s Ocean Observations Viewer, which displays in situ and satellite observations, and some derived products to assess ocean and atmospheric conditions. The interactive maps enable researchers to monitor ocean conditions and NOAA to plan its field operations by providing a user friendly interface with easy access to global and regional ocean-atmospheric observations and products. Researchers at AOML also use these maps to assess ocean and atmospheric conditions prior to, during, and after the passage of a tropical cyclone. The large set of targeted ocean observations featured in this product, including XBT’s, ocean gliders, drifters, and floats, enables AOML to better monitor ocean conditions.
As XBT deployments are made, the data will become available for viewing here.

SEAS-AMVERSEAS
SEAS-AMVERSEAS is a software for real-time acquisition and transmission of environmental data that is employed on ships of the Ship Of Opportunity Program, University-National Oceanographic Laboratory System (UNOLS), and U.S. Coast Guard vessels.
SEAS
Shipboard Environmental data Acquisition System
NOAA/AOML SEAS relies on ships of the Ship Of Opportunity Program and on NOAA, UNOLS and U.S. Coast Guard vessels to collect marine meteorological observations (e.g. wind speed), and ocean observations (e.g. Expendable BathyThermograph temperature profiles, Thermosalinograph sea surface salinity). The SEAS system acquires and transmits the data in real-time to the Global Telecommunication System, where the data are distributed to operational centers for weather forecasts and climate studies.
AMVER
Automated Mutual-Assistance Vessel Rescue
AMVERSEAS is an applications system used for data acquisition, data processing, data recording, and data transmission in real-time. This applications system operates on vessels to collect oceanographic data such sea temperature, and sea surface salinity, and to report marine weather conditions data that can be entered into scientific and operational databases. Moreover the software allows ships to report their intended voyage track so that in the event of an emergency all available resources may be focused on aiding ships in distress.
AMVERSEAS Software
AMVERSEAS is an applications system used for data acquisition, data processing, data recording, and data transmission in real-time. This applications system operates on vessels to collect oceanographic data such sea temperature, and sea surface salinity, and to report marine weather conditions data that can be entered into scientific and operational databases. Moreover the software allows ships to report their intended voyage track so that in the event of an emergency all available resources may be focused on aiding ships in distress.
We are strong because of our community.
Ship of Opportunity Program (SOOP).
NOAA’s Ship of Opportunity Program (SOOP) aids in the worldwide effort to deploy XBT’s.
The Ship of Opportunity Program is a global partnership between scientific institutions and the maritime industry. NOAA, specifically AOML, manages the US SOOP. AOML works to recruit ships to assist scientists in collecting oceanographic data from the global ocean.
To learn more about the Ship of Opportunity Program, read its brochure.

Transect Data
XBT data along the fixed transects of the global XBT network can be found through the institutions that lead the specific transect operations.

Global Data
Delayed-time, quality controlled data, is also delivered globally by NOAA/NESDIS through its World Ocean Data project.
Acknowledging NOAA/AOML HD XBT Data
Data from the XBT (eXpendable BathyThermographs) Project are made freely available to the public via these web pages and automatic real-time insertion onto the GTS. The project scientists would appreciate it if you added the following acknowledgment to any publications that use this data; “The XBT data are made freely available on the Atlantic Oceanographic and Meteorological Laboratory and are funded by the NOAA Office of Climate Observations.”
XBT Data Frequently Asked Questions
What are upper ocean thermal data?
In the most general sense, upper ocean thermal data are measurements made in the top 1 to 2 kilometers of the ocean. Two important upper ocean measurements are temperature and salinity. These variables are measured at the ocean surface using floating buoys, sensors mounted on ship hulls, or satellite infrared imagery. Below the surface, measurements are made using expendable probes (XBT’s or XCTD’s), moored buoys or sub-surface floats (either vertically profiling or drifting at a specific depth or density.
A fairly typical example of a temperature profile in the Atlantic Ocean is shown in Figure 1. This Figure shows the temperature of the water as a function of depth below the sea-surface. This particular profile was taken in December 1997 aboard a volunteer Merchant Ship called the M/V Morelos at about 26°N, 74°W in the Altantic Ocean as part of AOMLs high density XBT project. The temperature profile is typical in that near the surface of the ocean the temperature is warmer (here greater than 25°C or about 78°F) and the temperature gradually decreases with increasing depth away from the sea-surface (here the temperature decreases to less than 10°C or less than 50°F by 700m).
Why are upper ocean data important?
Importance of Upper Ocean Thermal (UOT) Data
The need for UOT data has been extensively documented in the program plans of the large-scale climate and oceanographic programs. For example, UOT observations are given as the third highest priority, after SST and surface winds, in the plan for post-TOGA observations (NRC, 1994). Directed at “supporting short-term climate predictions” the post-TOGA UOT data are “central to the successful initialization of coupled atmosphere-ocean models”. To date, UOT data have been shown to make a considerable improvement on predictive skill of NOAA’s Coupled Model Project (CMP) model (Ji, 1994, personal communication).
In WOCE, “there is a need for measurements of the change in heat content in the upper ocean, primarily as a way to improve the reliability of estimates of the heat flux” (WMO, 1986). In ACCP, UOT data collection and analysis are supported to study the role of subsurface oceanic processes on decadal SST variability (Molinari et al., 1994). In these and other programs, UOT data are also required to increase understanding of oceanic dynamics and for numerical model verification. TOGA, WOCE, and ACCP recognize the need for continued oceanographic observations and have as an important objective the establishment of the long-term measurement networks that will constitute GOOS.
The objectives and methodology of the UOTC are directly relevant to the goals of several of the OGP components. ACCP requirements in the program announcement include: “modeling of the maintenance and variability of the relatively warm upper layer in the Grand Banks region and the sea surface temperature field of the tropical Atlantic” and “use of conceptual and numerical models to synthesize near surface data”. Definition of climate signals and network evaluation studies will address both these requirements. Climate observations will “support design studies and observing system simulation experiments aimed at assessing the impact of ocean data on climate prediction”. The network evaluation studies are directly applicable to this objective. Finally, “GOALS will support research in the areas of monitoring, data management, empirical studies, modeling and prediction”, all objectives of the UOTC.
How are upper ocean thermal data collected?
UOT Data Collection
NOAA, other national groups and the international community have established several mechanisms for the collection of UOT data which are described below. An important consideration when designing these mechanisms for data acquisition is the sampling srategy necessary for particular scientific or operational needs.
To date, the primary source of UOT data has been the XBT Volunteer Observing Ship (VOS) program using Shipboard Environmental data Acquisition Systems (SEAS) for data collection and transmission. SEAS was developed by NOAA to provide accurate meteorological and oceanographic data in real time from ships at sea through the use of satellite data transmission techniques. The system transmits data through either the GOES or INMARSAT satellites to NOAA. Currently, SEAS has the capability to transmit surface weather, XBT, CTD and ADCP data.
Recently, two other observing systems have been deployed to provide UOT data. First, in the tropical Pacific, an array of moored buoys, the TOGA-TAO array, measures surface atmospheric and subsurface oceanographic variables for TOGA (Fig. 3). Although initially designed to observe surface wind fields, the TAO array provides continuous observations of UOT structure.
Second, Davis et al. (1992) describe a subsurface float that was originally developed to provide trajectories at preselected depths of the water column. The float is timed to return to the surface at desired intervals to transmit its position data through a satellite link to a land station. This ALACE float has since been modified to provide both temperature and salinity profiles obtained during its return to the surface.
In all three observing systems, the data are transmitted via satellite from the collection point to a land station where they typically undergo some quality control. The data are then retransmitted and captured by users such as CMP for various purposes. Data not transmitted in real-time are collected by data centers such as NODC, collated and then forwarded, at different intervals, to quality control centers for review. After editing, the data are returned to the data centers for storage and dissemination to other users.
How are upper ocean thermal data quality controlled?
XBT Quality Control
The following two papers describe the proceedures used at AOML to quality control XBT data:
Daneshzadeh, Y.C., Festa, J.F., Minton, 1994, Procedures Used at AOML to Quality Control Real Time XBT Data Collected in the Atlantic Ocean, NOAA Technical Memorandum ERL AOML-78.
Daneshzadeh, Y.C., Festa, J.F., Molinari, R.L., 1996, Quality Control of XBT Data Collected in the Atlantic Ocean
How are upper ocean thermal data distributed to users?
NOAA/AOML UOTC Data Pipeline
The Global Temperature Salinity Profile Project (GTSPP) of the Intergovernmental Oceanographic Commission – a World Meteorological Organization, has developed a protocol for the transmission, quality control and distribution of real-time upper ocean temperature (UOT) data collected from volunteer observing ships (VOS).
The Shipboard Environmental data Aquisition System (SEAS) is used to transmit XBT, thermosalinograph and weather observations through the GOES or INMARSAT satellite to the NOAA gateway. The data are then distributed on a daily basis to NCEP for use in short term forecasting, and via the Global Telecommunications System (GTS) to the Marine Environmental Data Service (MEDS) of Canada for quality control.
Three times a week MEDS transmits the data to the National Oceanographic Data Center (NODC) of the USA.
XBT Bibliography
Driving Innovative Science with Data.
Our Contribution to Global Ocean Observing.
The following is a list of scientific and technical publications that use eXpendable BathyThermograph (XBT) data. If your XBT publication is not listed here, please email us the complete reference.
Please contact the publication authors to obtain an electronic or printed version of the articles. Alternatively, you may conduct a Google search of the publication title, which may direct you to an electronic version of the article.
View PDF list by year.

Sharing Resources Delivers Results.
Expanding Reach Through Partnerships.
8
Shipping Companies
Eight shipping companies collaborate with AOML to deploy eXpendable BathyThermographs (XBTs).


More National & International Partners
Together with partners around the world, the XBT Network deploys XBT’s throughout the world’s oceans. While not a complete list of XBT Network partners, below is a list of key contributors:
Participant Institutions
- Atlantic Oceanographic and Meteorologic Laboratory (NOAA, USA)
- Australian Government Bureau of Meteorology (AUS)
- Bundesamt für Seeschifffahrt und Hydrographie (GER)
- Commonwealth Scientific and Industrial Research Organization (AUS)
- Cooperative Institute for Marine and Atmospheric Studies (USA)
- Institut de Recherche pour le Développement (FRA)
- Institute for Shipboard Education (USA)
- Integrated Marine Observing System (AUS)
- Italian National agency for new technologies, Energy and sustainable economic development (ITA)
- Marinha do Brasil (BRA)
- Centre National de la Recherche Scientifique (FRA)
- National Institute of Oceanography (IND)
- National Oceanographic Data Center (NOAA, USA)
- Scripps Institution of Oceanography (USA)
- Servicio de Hidrografía Naval (ARG)
- State University of New York (USA)
- Tohoku University (JPN)
- University of Cape Town (ZAF)
- Universidade Federal do Rio Grande (BRA)
- University of Rhode Island (USA)
- Woods Hole Oceanographic Institution (USA)
- Institut Français de Recherche pour l’Exploitation de la Mer (FRA)
- Institute for Shipboard Education, Semester at Sea Program (USA)
Private Industry Partners
- Lockheed Martin Sippican, Inc.
- T.S.K. – The Tsurumi Seiki Co., Ltd.
- Hapag-Lloyd
- Maersk Line
- Bermuda Container Line Ltd.
- Horizon Lines
- Mitsui O.S.K. Lines
- Hamburg Süd Liner Shipping
- CMA CGM Group
- Eimskip