

In 2018, an Australian couple curiously stumbled upon a bottle of gin washed ashore in Wedge Island, Australia. Yet, there was no gin inside. Rather, preserved within the bottle was a note with the date June 12th, 1886; the name of a German barque, Paula; the ship’s departure and arrival ports; and the exact coordinates of the ship at the time the bottle was set adrift. Further, the note requested that the finders of this bottle record the date and location of the discovery and return it to the Deutsche Seewarte in Hamburg or the nearest German embassy¹. This wasn’t a poetic gesture or a pastime for sailors—it was an experiment in which researchers and ship captains would throw bottles adrift to study currents and optimize shipping routes¹. Thanks to these message in a bottle experiments and major advances in physical oceanography and technology, we now understand that the oceans are not isolated bodies of water, but part of a vast and complex, interconnected system.
Today, instead of glass bottles and handwritten notes, scientists rely on a fleet of innovative technologies—like global ocean drifters and Argo floats—to collect and transmit critical data about ocean conditions and complex ocean dynamics. Thanks to these tools, physical oceanography has made remarkable strides, enabling us to better predict extreme weather, support search-and-rescue missions, and understand the ocean’s influence on our planet.
At its core, physical oceanography is the study of how the ocean behaves and interacts with the environment. Variables like temperature, salinity, density, and pressure may seem independent, but they are deeply intertwined—governing the movement of water, the transfer of heat, and the development of weather systems. These interactions play out not just beneath the waves, but also at the air-sea boundary, shaping weather patterns that affect life across the planet. At NOAA’s Atlantic Oceanographic and Meteorological Laboratory (AOML), the Physical Oceanography Division is at the forefront of documenting and understanding the complex physics and dynamics that are ever changing in the world’s oceans. Armed with an array of sophisticated instruments and data processing centers, AOML is uniquely situated to capture and analyze the ocean’s vital signs in near real time.
In physical oceanography, one of the most powerful tools at hand are Argo floats. Argo floats are robotic, autonomous, free drifting floats that measure key variables including temperature, salinity, and pressure. These instruments float with currents, pausing to vertically traverse the ocean layers as deep as 6,500 feet. Since 1997—the inception of Argo deployments—to May 31, 2025, U.S. Argo deployments have surmounted 9,300 floats, with 2,211 that are actively collecting data. This represents approximately half of a large global network of floats, which work in tandem to profile ocean basins. The core Argo array—which solely measures temperature, salinity, and pressure—is complemented by the deep Argo and Biogeochemical (BGC) Argo arrays. Deep Argo floats expand the sampling range of these autonomous robots with floats capable of reaching depths as great as 19,500 feet (~3.7 miles). BGC Argo floats are equipped with sensors to measure chlorophyll-a fluorescence, oxygen, nitrate, pH, and suspended particles, in addition to temperature, salinity, and pressure. Argo floats are deployed during research cruises (by AOML and partners) and by voluntary ships (e.g., container ships, Volvo ocean race, etc.).

Every ten days, the floats rise from the depths and transmit their data via satellite to a data assembly center (DAC) where the data are quality controlled (QA/QC). As the designated DAC for all U.S. Argo floats, AOML is central to this stage of the deployment. Once the measurements are QA/QC’d at the DAC, they are transmitted to the Global Telecommunication System (GTS – for real-time ingestion into ocean and weather models), as well as to two Global Data Assembly Centers (GDAC: U.S. and France). Argo float data is freely accessible to the public via these two GDAC’s: the USGODAE Argo Global Data Assembly Center and the Coriolis Argo Global Assembly Center.


What makes these observations so powerful? These measurements enable scientists and operational weather and ocean prediction centers to assess changes in our oceans over space and time. They are foundational to ocean heat and salinity measurements, which inform hurricane intensity predictions and provide insights on global ice volume and sea level changes, key drivers of coastal flooding. Argo data even provides insights for land-based phenomena like drought and precipitation predictions, which have impacts as far reaching as food security. Furthermore, Argo measurements improve safety by filling in observational gaps in ocean and extreme weather forecasts that ultimately support a wide array of operational hazard responses, search and rescue operations, and aviation and space weather monitoring. As if that wasn’t enough, Argo data supports commerce through measurements that help determine safer and more economic shipping routes, support U.S. tourism, and the management of marine ecosystems and fisheries.

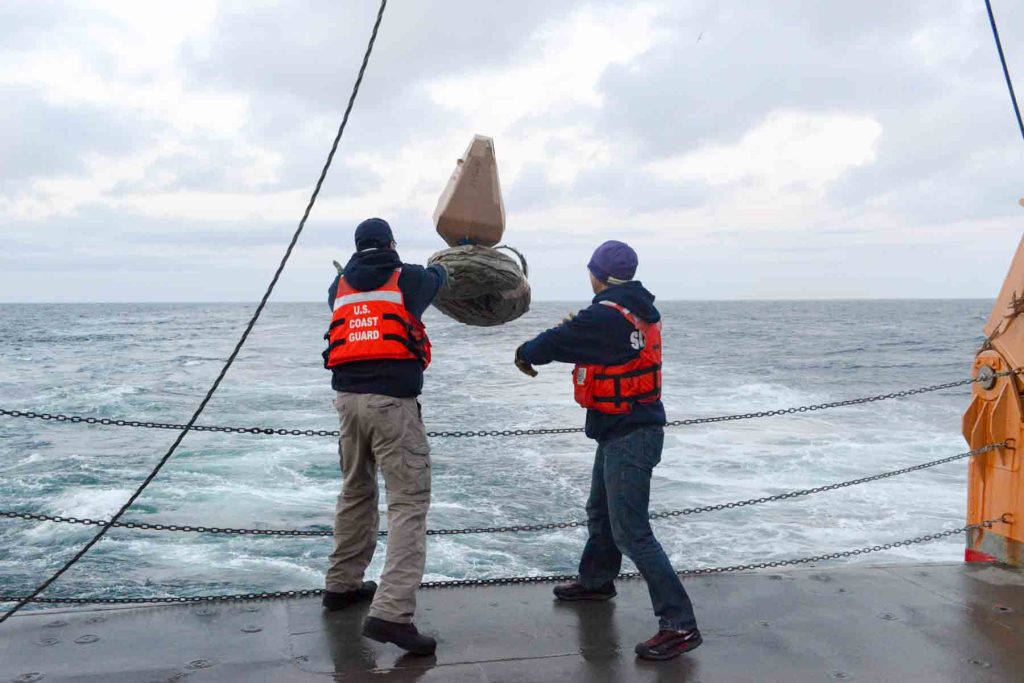
Another instrument central to AOML’s oceanographic observations is global ocean drifters—the modernized version of a message in a bottle. When weather forecasters began developing numerical models in the 1950s and 1960s, they quickly discovered that the main obstacle to improving forecast accuracy wasn’t limited computing power—it was a lack of observational data. While land-based stations could measure and relay air pressure data, they covered only a fraction of the globe. With over 70% of Earth’s surface covered by oceans, vast regions remained unmonitored. To fill this critical gap, NOAA’s Global Drifter Program (GDP) operates a network of roughly 1,300 drifting buoys across the world’s oceans.
These drifting buoys are equipped with sensors and a transmitter that float at the surface, connected by a long tether to a holey-sock drogue, or sea-anchor, that extends roughly 65 feet beneath the waves, allowing upper ocean currents to push the instrument rather than surface winds. With coordinated deployments through the GDP’s Drifter Operations Center at AOML, these instruments ride ocean currents and record sea surface temperature. Yet, many drifter models are capable of measuring additional environmental variables including atmospheric pressure, wind speed, wave height, and salinity. These observations are compiled by the drifter’s built-in sensors and transmitted via satellites overhead to the GDP’s Data Assembly Center, also located at AOML, for quality control. Thanks to this satellite technology, drifters can be tracked in real time with an interactive mapping tool and their data is freely available through the Global Telecommunications System (GTS) and hosted on AOML’s ERDDAP server. Teachers can Adopt a Drifter for their classroom to teach students about ocean science.
What’s the bigger picture obtained from global drifter data? The ability of drifters to provide large swaths of observations in previously inaccessible regions has a domino effect on forecaster’s abilities to more accurately predict weather and ocean conditions; they enable faster and more precise responses to victims lost at sea; and they provide an understanding of how oil spills and other floating particles like marine debris or Sargassum algae will disperse through the ocean. Drifters inform the likelihood of rapid intensification of hurricanes, optimize shipping routes, and they help to quantify the transport of marine debris.
Time and again, oceanographic instruments—from sub-surface Argo floats to surface drifters—demonstrate the vast array of critical insights we gain through ocean observation, reinforcing the enduring importance of physical oceanography. From the ocean’s surface to its deepest depths, demystifying ocean dynamics yields invaluable benefits for commerce, safety, recreation, and the broader interests of humanity.
Citations
¹: Guinness World Records. (2018, March 8). Oldest message in a Bottle. https://www.guinnessworldrecords.com/world-records/oldest-message-in-a-bottle.