
AOML’s hurricane scientists conducted multiple airborne missions into several tropical systems that formed in the Atlantic in September and October. The data gathered in Humberto, Jerry, pre-Karen, Lorenzo, and Nestor improved track and intensity forecasts, aiding NOAA’s efforts to prepare vulnerable communities for severe weather. The missions also supported research to better understand how tropical cyclones form, intensify, and dissipate, as well as supported efforts to validate satellite measurements of these storms.
Missions aboard NOAA’s Hurricane Hunter aircraft were undertaken to gather tail Doppler radar and dropsonde observations. These data are critical for accurate forecasts, as they provide vital information about storm structure and intensity, as well as information about the atmosphere’s temperature, humidity, and pressure.
AOML’s hurricane scientists obtain them by sampling the environment around the periphery of a storm, as well as by flying directly through the bands of towering thunderstorms that circle the eye. Here in this turbulent region reside the strongest winds and pockets of heaviest rainfall. The data are quality controlled in real-time by AOML scientists aboard the aircraft and transmitted for assimilation into NOAA’s Hurricane Weather Research and Forecasting model.
“Many of the storms we flew in 2019 were ‘living on the edge,’ in that they were weak, vertically sheared, but also unpredictable. In previous years, we saw these storms intensify, such as Hurricane Michael in 2018. This season, many struggled to intensify. As we continue to build a dataset of these sheared storms, we look towards improving our ability to accurately predict their future intensity change.”
-Jon Zawislak, PhD, Director
NOAA-Hurricane Field Program
Missions began aboard NOAA’s P-3 Hurricane Hunter aircraft on September 13 as Humberto became the eighth named storm of the 2019 Atlantic season. Humberto intensified on its north-northeastward path, moving east of the US mainland and the Bahamas before becoming a hurricane on September 15.
Three of the Humberto missions were to gather tail Doppler radar and dropsonde observations in support of the operational requirements of NOAA’s Environmental Modeling Center to improve forecast models. The fourth and final mission flown on September 16 focused on collaborative research with colleagues from NOAA’s National Environmental Satellite, Data, and Information Service Ocean Winds program to measure and validate surface wind speeds obtained aboard the P-3 against satellite measurements.
Humberto intensified into a major Category-3 hurricane as it approached Bermuda, passing over the eastern portion of the island on September 18 with 125 mph winds as Jerry formed in the western Atlantic.
AOML hurricane scientists conducted two P-3 research missions into Jerry beginning on September 20 as the storm strengthened into a Category-2 hurricane. Both missions were undertaken to gather data for research studies but also supported operations by collecting, quality controlling, and transmitting tail Doppler radar and dropsonde observations off the P-3 in real-time.
NOAA’s G-IV high-altitude jet also conducted four missions between September 15‑21 to sample the environment in and around the periphery of Jerry, with two missions being for research purposes. One of these missions was conducted in collaboration with partners from NOAA’s Joint Polar Satellite System program to validate moisture measurements from NOAA satellites against data from dropsondes deployed from the G-IV, which measure humidity as they descend toward the ocean.
The goals of the P-3 and G-IV missions were also for data collection in support of the early and mature stage science objectives of NOAA’s Hurricane Field Program-Intensity Forecast Experiment. Data gathered for these objectives will help scientists better understand how storm structure changes in moderate to high levels of vertical wind shear, typically considered detrimental to intensification. Jerry’s circulation became tilted with height due to wind shear, and AOML scientists uniquely observed changes in humidity and precipitation as its circulation structure changed.
Jerry will serve as a great comparative case for other sheared storms sampled by AOML scientists over the past few years, e.g., Hermine, Nate, and Michael. Against the odds, these storms intensified. Hurricane Jerry, however, dissipated at sea.
As Jerry deteriorated, Lorenzo formed in the eastern Atlantic and strengthened into a hurricane on September 25. After rapidly intensifying, Lorenzo emerged as a catastrophic storm with 160 mph winds on September 28. The powerful storm became the second Category-5 hurricane of the 2019 Atlantic season and broke records as the strongest tropical cyclone to date ever measured in the central North Atlantic.
Three P-3 research-tasked missions were flown out of Barbados to investigate Lorenzo on September 28-29. AOML scientists observed both a strengthening and weakening of Lorenzo’s intensity, both of which occurred as the storm was influenced by moderate vertical wind shear. The G-IV also flew three research missions dedicated to satellite validation in support of the Joint Polar Satellite System program.
The Lorenzo missions marked the first hurricane flown by the P-3 “Miss Piggy” Hurricane Hunter aircraft since 2016 and included a day in which all three NOAA hurricane aircraft, both P-3s and the G-IV, flew simultaneously in and around the storm. Lorenzo weakened on its path across the Atlantic toward Europe, passing over the Azores Islands of Portugal as a Category-1 hurricane before coming ashore in County Donegal, Northern Ireland as a post-tropical cyclone.
Almost 3 weeks later on October 18, AOML’s hurricane scientists flew two P-3 missions in Tropical Storm Nestor as it formed in the southern Gulf of America. In addition to gathering tail Doppler radar and dropsonde observations, they also surveyed Nestor’s developing low-level circulation, as well as the extensive rain and wind fields on Nestor’s northern and eastern sides. Although Nestor was short-lived, the storm flooded portions of the Florida Panhandle as it moved ashore on October 19.
AOML’s hurricane scientists flew multiple missions in September-October as the Atlantic entered it peak period for hurricane activity. The data gathered in Humberto, Jerry, Lorenzo, pre-Karen, and Nestor will support future research studies and were vital to accurate, up-to-date forecasts, supporting NOAA’s mission of building a more weather-ready nation.

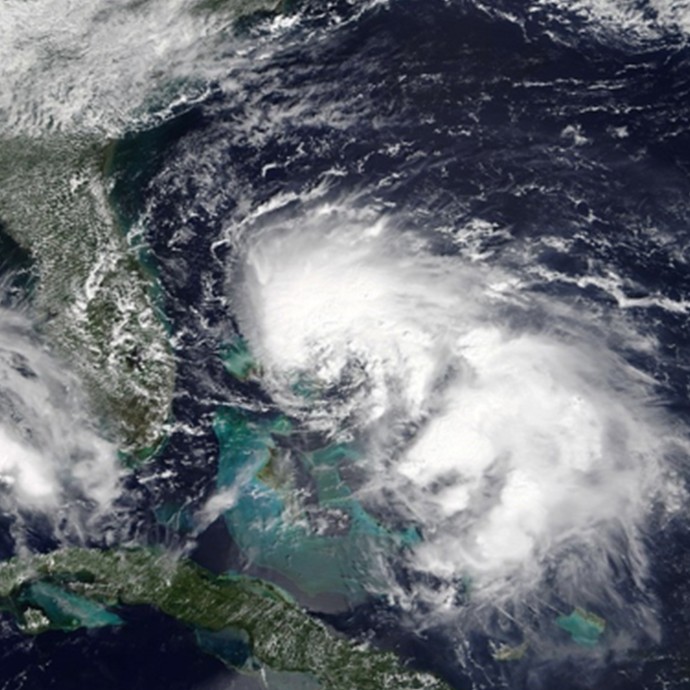
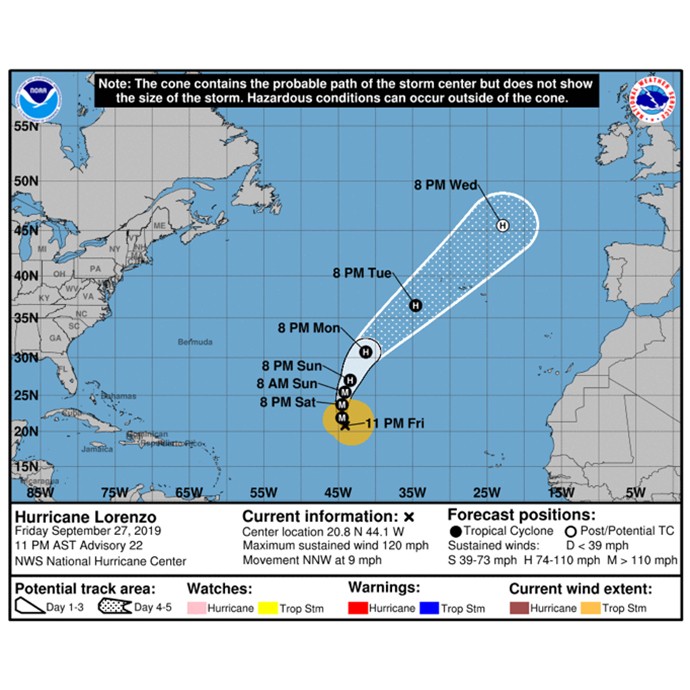
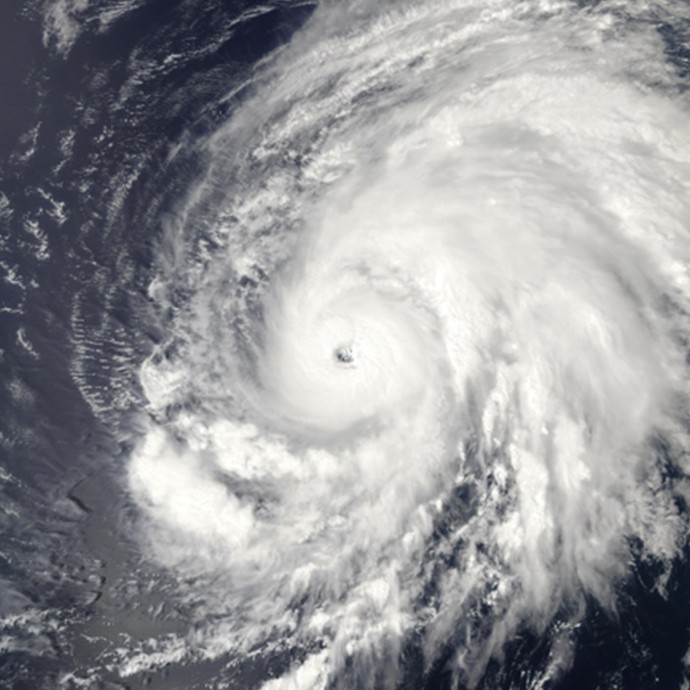
Image Captions
From Left:
- AOML hurricane scientists Trey Alvey and Lisa Bucci prepare their workstations aboard NOAA’s P-3 Hurricane Hunter aircraft as they head out to collect observations in Hurricane Humberto. Image credit: NOAA
- Satellite image of Tropical Storm Humberto east of the Bahamas on September 14. Image credit: NOAA
- National Weather Service map of the Atlantic basin showing Hurricane Lorenzo’s predicted path on September 27 based on data from an array of observing platforms, including airborne hurricane hunter missions. Image credit: NOAA
- Satellite image of Lorenzo in the central North Atlantic at peak intensity on September 28, 2019. Image credit: NOAA
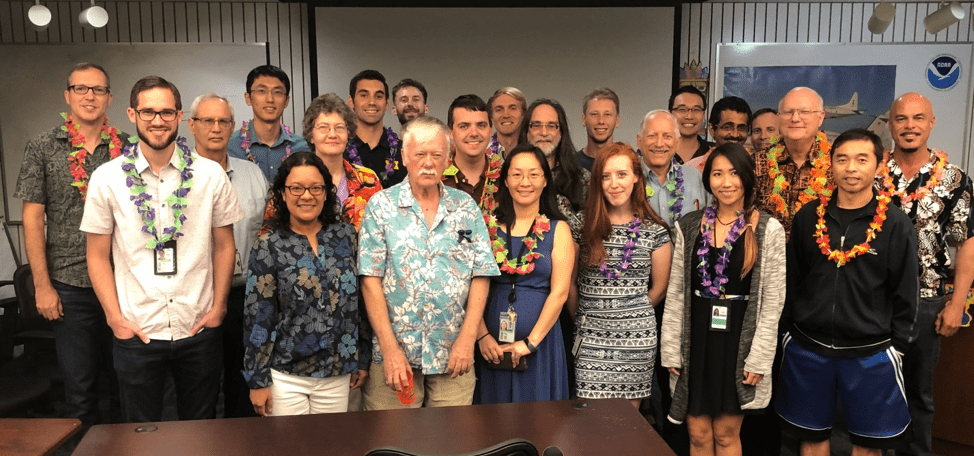
- AOML’s hurricane scientists and friends celebrated the last regularly scheduled tropical weather discussion of the year on October 18. While an AOML crew gathered data in Tropical Storm Nestor, those on the ground gathered for Aloha Friday. AOML hosted the daily discussions throughout hurricane season to review storm activity in the Atlantic and Pacific basins. This year’s discussions were presented by scientists and students from AOML, the National Hurricane Center, and an assortment of universities and cooperative institutes. Image credit: NOAA