
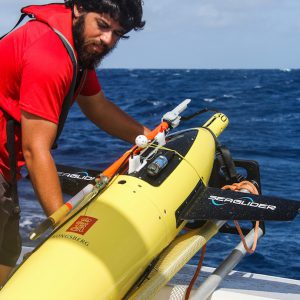
The surface cooling forced by hurricanes can ultimately cause a negative feedback mechanism on the hurricane, leading to a potential reduction in the intensity of the hurricane. Understanding the processes behind these air-sea interactions that take place in hurricanes is one of the goals of the network of underwater gliders* implemented by AOML in 2014.
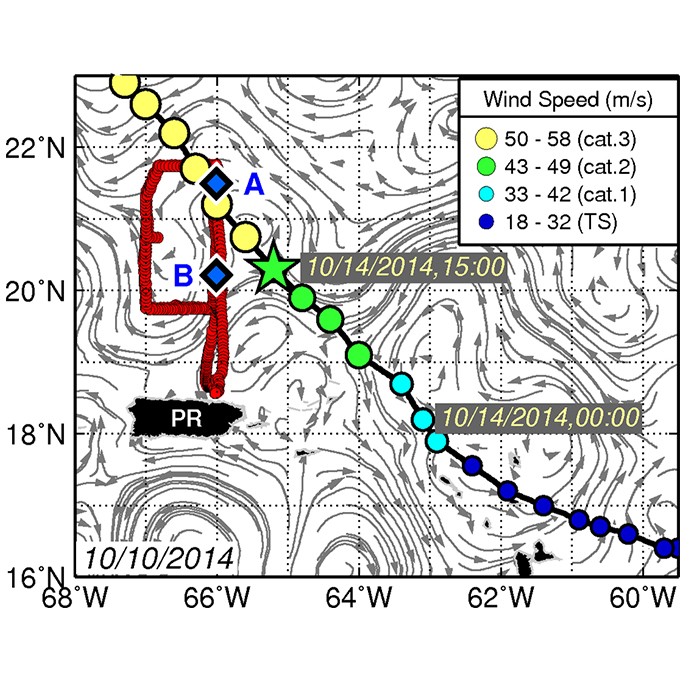
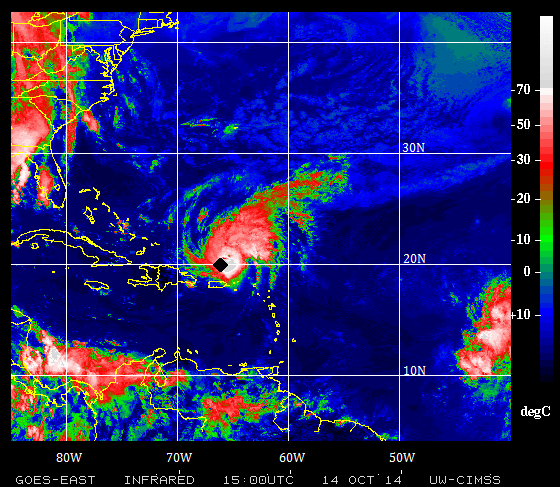
In a study recently published in Geophysical Research Letters (Domingues et al., 2015), researchers from AOML, the University of Miami’s Cooperative Institute for Marine and Atmospheric Studies (CIMAS), and their colleagues at the University of Puerto Rico Mayaguez and at the Environmental Modeling Center, identified the importance of salinity effects in reducing the upper-ocean cooling during Hurricane Gonzalo (2014) using the observations collected by one glider. Hurricane Gonzalo formed on October 12, and traveled within 85?km from the location of the glider situated north of Puerto Rico on October 14. At that stage, Hurricane Gonzalo was a category 3 hurricane with maximum sustained winds of 115 mph. Observations collected before, during, and after the passage of this hurricane were analyzed to help improve understanding of the upper-ocean response to hurricane winds and of the ocean recovery after the passage of the storm. The study revealed that salinity conditions below the surface of the ocean created a barrier against the strong wind forcing of the hurricane, which in oceanographic terms is simply named as a ‘barrier layer’. The presence of this barrier layer prevented the strong mixing forced by the hurricane. As a consequence, cooling of surface waters was small compared to cooling forced by other hurricanes with similar strength in areas where the barrier layer was not present. This is important because the small cooling of surface waters may have favored the intensification of Gonzalo, which continued intensifying as it travelled over the region where the glider was located.
The study further revealed that salinity effects observed in the real ocean were not properly represented in one of the ocean models that is used for hurricane forecast, the HYbrid Coordinate Ocean Model (HYCOM) coupled to the Hurricane Weather Research Forecast model (HWRF), HWRF-HYCOM. As a consequence, HWRF-HYCOM overestimated the surface cooling forced by winds of Hurricane Gonzalo, which ultimately caused an underestimation in the intensity forecast of Gonzalo. Identifying such discrepancies and understanding the mechanism behind them is one way for improving tropical cyclone intensity forecasts. The study concludes that a better model representation of salinity conditions may improve simulations of the ocean response and future hurricane forecasts in this region, given the important role of salinity suggested by the observations analyzed in this study. Results presented in this study emphasize the value of underwater glider observations for improving our knowledge of how the ocean responds to tropical cyclone winds and for tropical cyclone intensification studies and forecasts.
*Underwater gliders are remotely operated vehicles that can collect and transmit ocean data in real-time for specified regions of interest.