The fate of the Deep Western Boundary Current in the South Atlantic

The pathways of recently ventilated North Atlantic Deep Water (NADW) are part of the lower limb of the Atlantic Meridional Overturning Circulation (AMOC). In the South Atlantic these pathways have been the subject of discussion for years, mostly due to the lack of observations. Knowledge of the pathways of the AMOC in the South Atlantic is a first order prerequisite for understanding the fluxes of climatically important properties.

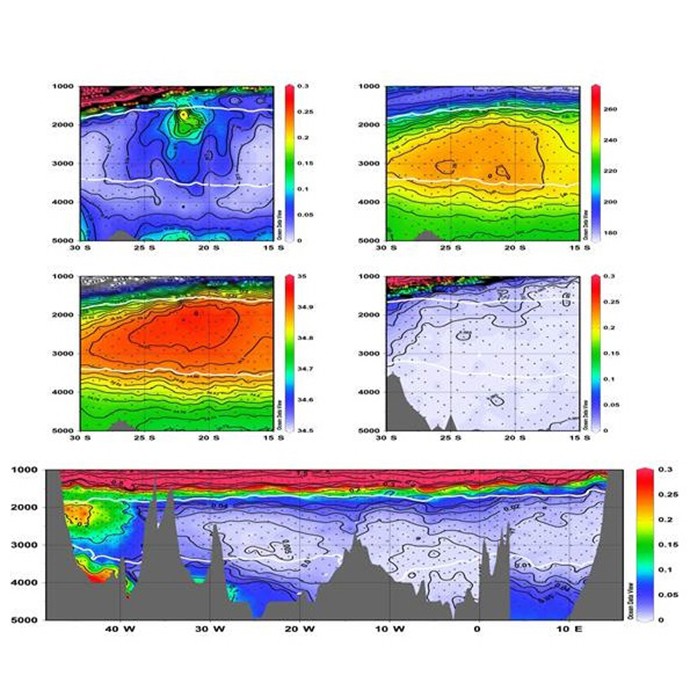
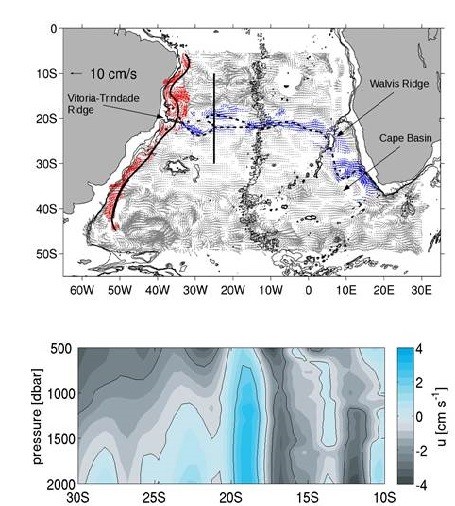
Historical and new observations, including hydrographic and oxygen sections, Argo data, and chlorofluorocarbons (CFCs), are examined together with two different analyses of the Ocean general circulation model For the Earth Simulator (OFES) to trace the pathway of the recently ventilated NADW through the South Atlantic. CLIVAR-era CFCs, oxygen and salinity clearly show that the strongest NADW pathway in the South Atlantic is along the western boundary (similar to the North Atlantic). In addition to the western boundary pathway, tracers show an eastward spreading of NADW between ~17-25°S. Analyzed together with the results of earlier studies, the observations and model output presented here indicate that after crossing the equator, the Deep Western Boundary Current (DWBC) transports water with the characteristics of NADW and a total volume transport of approximately 14 Sv (1 Sv = 10 6 m 3 s -1 ). Crossing 5°S and mostly concentrated west of 30°W, the DWBC carries NADW along the coast of South America and, in the model in agreement with previous results, breaks up into rings near 8°S, a region where the flow is mostly “non-steady.” Analyses of the eddy kinetic energy (EKE) at different depth levels in the model indicate high levels of energy spreading further offshore south of 8 ° S, consistent with the formation of energetic rings. This “ring-dominated” flow continues southward to the Vit ó ria -Trindade Ridge (near 20°S). When the ring-dominated flow reaches the Vit ó ria -Trindade Ridge, the NADW is forced to flow to the east due to the topography. The branching of the flow in this area is due to the preservation of potential vorticity (Zangenberg and Siedler, 1998). Theory suggests that part of the along-slope southward flow turns into a zonal flow to the east at the latitudes where the change in planetary vorticity is sufficiently large to compensate for the change in potential vorticity due to the initial depth changes. The main portion of the NADW flow continues along the continental shelf of South America in the form of a strong reformed DWBC, while a smaller portion, about 22% of the initial transport, flows towards the interior of the basin.
Partial CLIVAR sections demonstrating the spread of NADW eastward into the central South Atlantic Ocean. Vertical axis is depth in meters. Panel a) partial A16S section of CFC-11 from 15 ° -30 ° S along about 25 ° W from 1000-5000 m. The lowest contour for CFC-11 concentration is 0.01 pmol kg -1 . Color scale given on the right; two neutral density surfaces are 27.9 and 28.1 kg m -3 are identified as white lines . Panel b) Same as panel a) except for oxygen concentration in m mol kg -1 . Panel c) Same as panel a) except for salinity. Panel d) partial A13 section of CFC-11 from 15 ° -30 ° S along about 5 ° -10 ° E from 1000-5000 m. The lowest contour for CFC-11 concentration is 0.005 pmol/kg. Panel e) full cross-basin section of CFC-11 along A10, 30 ° S from 1000-5000 m. Note for a, d, and e that 0.3 pmol kg -1 is the highest concentration CFC-11 contoured and higher concentrations will appear in the same shades as for 0.3 pmol kg -1.
Top panel: Velocity field at 2000 dbar derived from the Argo data. Red vectors highlight the southward to southwestward flow along the western boundary; blue indicates the eastward velocity originating near the Vitória-Trindade ridge. Isobaths: 2000, 2500 and 3000 m. Solid curves highlight the pathway of the DWBC along the South American coast. Dashed lines indicate regions where the pathway is less well defined as it moves to the interior of the basin. The meridional line indicates the location of the vertical section displayed in the lower panel. Areas with no vectors or shading indicate that velocities are too small to be significant with respect to a 95% confidence interval. Lower panel: Meridional-vertical structure of the eastward pathway in the top panel showing the zonal velocity in cm sec -1 along 25°W from 10° to 30°S.


Garzoli, S.L ., S. Dong , R. Fine, C. Meinen , R.C. Perez , C. Schmid , E. van Sebille, and Q. Yao. The fate of the Deep Western Boundary Current in the South Atlantic. Deep-Sea Res.I, , doi: 10.1016/j.dsr.2015.05.008.