Digital Coral Morphology
Advancing coral conservation & restoration by exploring structure and reef complexity
Corals provide the physical structure that supports a staggering and vast diversity of life on a reef ecosystem, but the persistence of these complex structures is heavily influenced by changes in ocean chemistry and the environment. Using an arsenal of state-of-the-art technologies and innovation, the Digital Coral Morphology Lab within the AOML Coral Program seeks to characterize, quantify and monitor changes in the physical structure of corals and reef frameworks in the wake of a changing climate and increasing environmental stressors.
Who We Are


Our Lab
Corals and coral reefs are structurally complex. Branching, encrusting, table-shaped, brain, and mounding corals, no two colonies are the same. Even inside the skeletons of these corals, networks of holes are formed by worms, sponges, and mussels as they dissolve away their skeletons. Across large reef ecosystems, surface topography and elevations can change drastically, from reef flats to slopes, spur and groove formations, to flat beds of rubble. We have to measure, characterize, and monitor these complex features, no small task considering the diverse array of shapes and sizes present on a reef.
To address this challenge and advance the fields of coral reef ecology and conservation, we use new digital technologies. We use 3D scanning and macro- & micro- Computed Tomography (CT) to collect data from subjects as large as coral reefs to as small as the internal structures of coral polyps. Structure-From-Motion (SFM) Photogrammetry and three-dimensional mapping are employed to assess reef structural complexity, benthic coral cover, and characterize habitats for several ongoing management and conservation efforts.
Click the icons to explore our capabilities.
3D Scanning
Our team uses 3D scanning to produce high-resolution images of corals with precise measurements of surface area and volume. Repeatedly scanning coral fragments allows us to track changes in their growth overtime and in response to varying environmental conditions.
")
Coral Program Intern Kenzie Cooke scans a fragment of Acropora cervicornis (Staghorn coral) to produce a 3D Image.
The Process
Tracking changes in the growth rate of corals overtime (usually over months) also allows us to standardize measurements for specific coral species and genotypes, identifying baseline calcification rates that can be applied to models on a larger scale.

3D Model of Acropora cervicornis (Staghorn Coral).
In our Experimental Reef Lab (ERL), where coral fragments are exposed to changes in environmental stressors (temperature, pH, and/or light treatments), 3D scanning allows our team to assess how these stressors affect a coral’s growth rate at a high resolution. Monitoring changes in a coral’s surface area and volume by repeatedly scanning fragments exposed to these stressors allows us to identify what genotypes may grow better under varying conditions.

The Coral Program’s Experimental Reef Lab (ERL)
Computed Tomography (CT)
Corals produce a band of high-density skeleton each year as they grow, like the rings of a tree. Every year they grow a layer that is denser than the previous, and with Computed Tomography (CT) we can measure the distance between those bands. This allows us to calculate their growth rates in the recent and historic past, and the amount of material the coral has put down in that year. At the same time, corals’ internal structures play host to a variety of organisms known as “bioeroders,” and our lab analyzes the rates at which coral skeletons are eroded.
To achieve this, we employ three key strategies to examine large tracts of reef without bringing serious harm to the sites we monitor:
- Extracting Coral Cores
- Deploying Bioerosion Monitoring Units (BMUs)
- Micro CT

Digital Morphology Technician Ben Chomitz loading carbonate samples into the CT scanner.
Extracting Coral Cores to Analyze Growth Rates
The Process
Coral Cores are cylindrical samples extracted from existing reefs that provide key insights to the internal structure and historical growth on the scale of decades.
")
Extracted Coral Cores are placed on the medical CT machine at AOML to be scanned.
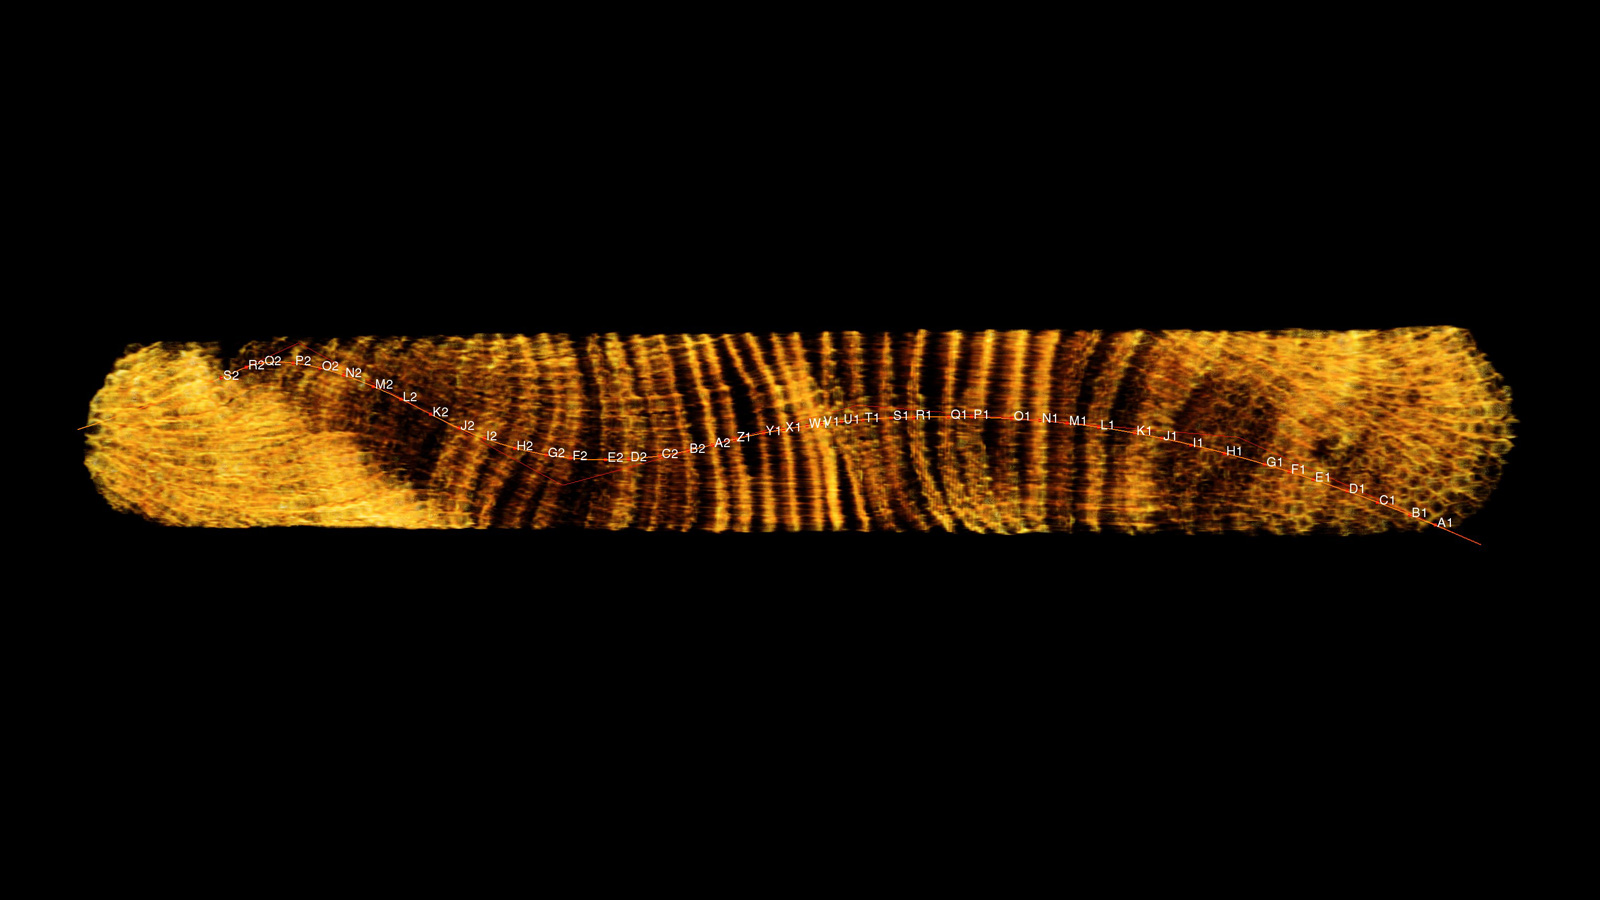
With this scanned image, we pull a virtual thread through each of the polyps as they grow on top of each other over the years. This thread represents the growth axis of the coral. By measuring the length of this line between each of the growth bands we can get the linear extension of the coral.

The polyps visible at the surface on a reef constitute the newest growth of the coral and the live end of the core.
Because the CT machine sees density, we can measure the distance between these bands to get the growth rate for each year of the coral colony’s life. We can calculate the amount of calcium carbonate material that the coral builds each year by measuring the density of the core between growth bands.


This graph displays the density of the coral along the length of the colony’s growth axis, i.e. the virtual thread pulled through the core. Each “peak” is a high density band, the distance between those peaks is how much the coral has grown in a year. The distance between the peaks multiplied by the average density of the coral between peaks is the calcification rate.
Our lab has over 2,000 cores from all over, primarily from the reefs of the Florida Keys. Continuing to analyze these cores allows us to measure historical growth and calcification rates of corals. Additionally, given our understanding of the relative timeline over which the corals grew, we can correlate past climate events with growth characteristics of coral, unlocking not only what happened in the past but how corals may respond to a changing climate in the future.
Bioerosion Monitoring Units (BMUs)
We use Bioerosion Monitoring Units (BMUs) to directly measure the rate at which the reef structure is eroded by marine organisms in our study sites. A BMU is a block of coral that is carefully weighed, measured, and CT-scanned before they are deployed to the sea floor.
BMU Pre-Deployment BMU Being Recovered
The BMUs are then weighed and scanned again with the CT Machine. By comparing the pre- and post- scans, we can precisely quantify the volume of material that is accreted (produced) or eroded away from reef structures at the study site. We can also identify which organisms are responsible for these changes (e.g. clams, sponges, worms). These data provide real-world context for the predictive modeling and lab experiments conducted by the Coral Program at AOML.

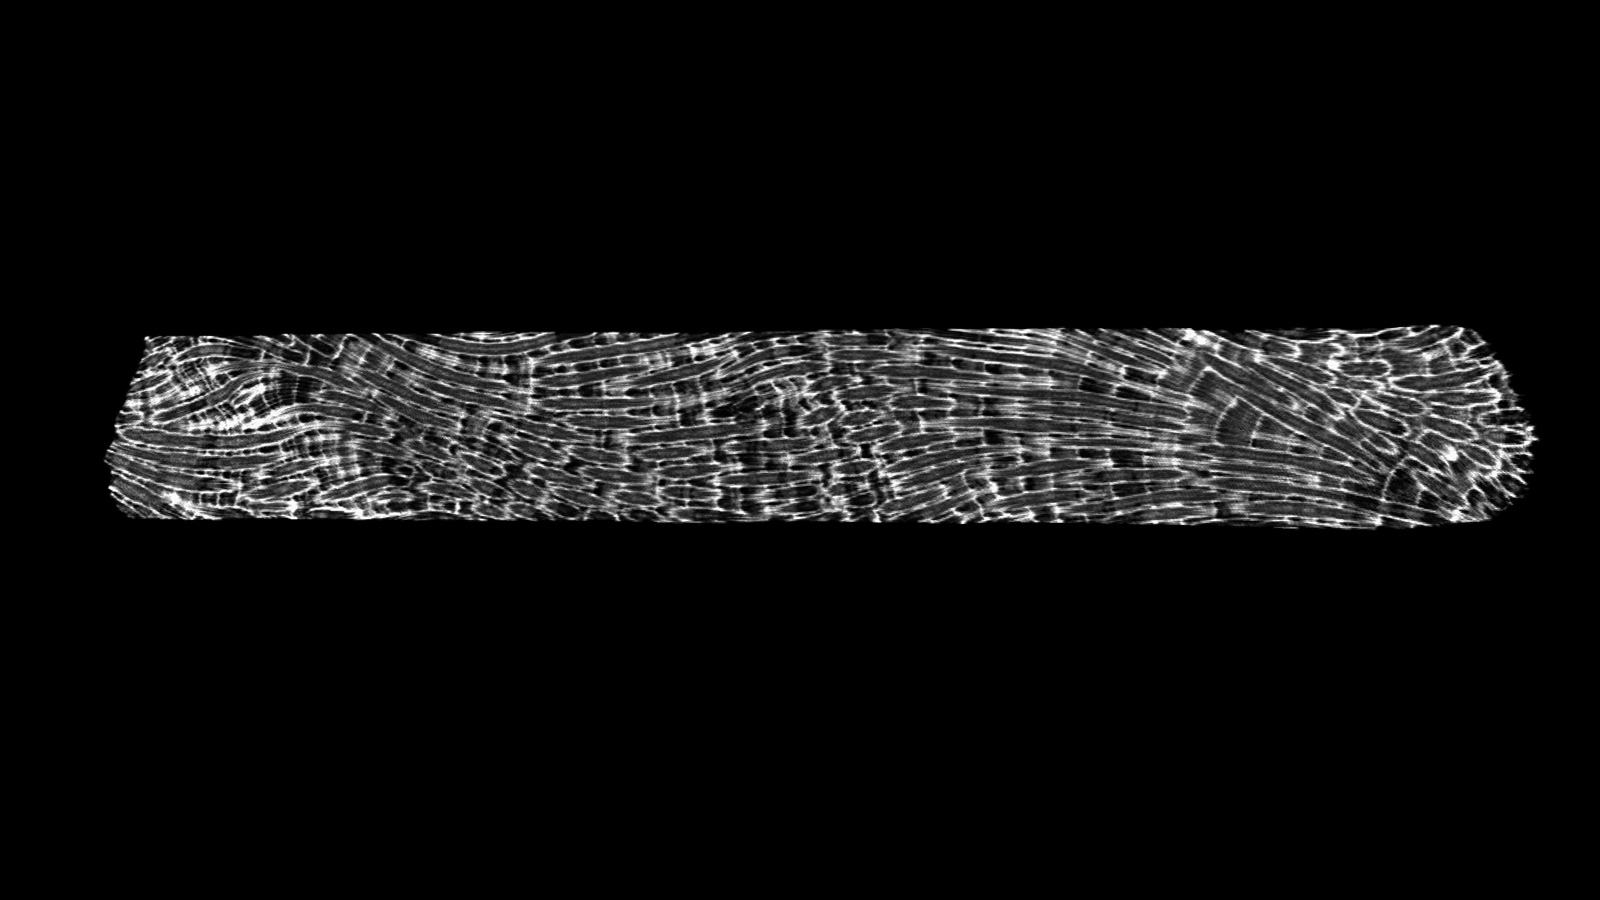
The internal structure of a BMU after being deployed in the field.
When the BMUs are retrieved two to four years later, they are encrusted and internally eroded by the marine organisms that build and break down the reef structure.

Predeployment Post-Deployment
“There is a whole ecosystem that lives within the carbonate structure of corals, and people just don’t pay that much attention to it. You can see the worm paths, the number of clams, the amount of sponge erosion and we can get a real sense of what animals live inside the corals themselves.” – Ben Chomitz, Digital Morphology Technician
The Micro-CT machine is used for the measurement and observation of micrometer scale structures. While initially coral cores and BMU’s were chopped into smaller pieces to examine the growth bands, the advancements of our lab and integration of the Macro-CT machine allowed us to expand our use of the Micro-CT to more research in ocean chemistry, examining the skeletons of marine microorganisms with like formanifera, diatoms and others with a carbonate calcified skeletons. The Micro – CT allows us to measure the density of these organisms as we begin to analyze how they influence ocean chemistry and natural processes.

Photogrammetry and Mosaics Explained
Assessing changes in coral cover and abundance of specific species, bioerosion, and how reefs respond to environmental stressors such as a mass bleaching events over long periods of time are among the many possibilities unlocked by SFM Photogrammetry.
Photomosaic Fly – Through of Cheeca Rocks
Performing Photomosaic Surveys

The blue layer here shows the area of the reef covered with the camera after moving in a lawnmower patter across the area. This area is repeatedly covered when performing photomosaic surveys in the field.
Scientific divers use high resolution cameras to capture images used to build 3D models by swimming in a lawnmower pattern horizontally above the reef substrate.


Kayelyn Simmons, Ph.D. analyzes photomosaic of reef produced from survey.
Acquired images are loaded into the computer software Metashape Agisoft v1.8 to produce two types of images that allow us to examine the 3D complexity and minute details of these benthic ecosystems:
- Digital Elevation Models
- Orthomosaic Models
Digital Elevation Models (DEMs)

Digital Elevation Model shown with scale bars and ground control points. Ground control points used to georeference the models.
DEMs aid in answering questions about reef structural growth (accretion) and erosion over time. Specifically, DEMs allow us to observe changes in calcium carbonate accretion and erosion, quantifying habitat complexity metrics (i.e., rugosity, ruggedness, shelter space), and changes in sediment depth following impacts from anthropogenic (i.e. human) stressors such as dredging or natural stressor events (i.e., hurricanes).
Orthomosaic Models
")
Orthomosaic of Cheeca Rocks 2020 3D model. Aids in answering questions about reef structural growth (accretion) and erosion over time.
High resolution orthomosaics aid in quantifying benthic cover such as the percent cover of corals and sponges to the species level as well as help track and monitor the spread of coral disease or the success of newly outplanted coral species over space and time. This method is currently being used at AOML to support several on-going projects such as NOAA Office of National Marine Sanctuaries Mission Iconic Reefs and NOAA’s National Coral Reef Monitoring Program.
Monitoring Florida Reefs Using Photomosaic Models
Cheeca Rocks, a shallow inshore coral reef and long-term climate monitoring site of the National Coral Reef Monitoring Program (NCRMP), is surveyed frequently to produce photomosaics tracking changes in the reef’s structure over time.
When the reef was found completely bleached due to the persisting marine heatwave of 2023, our team acted quickly to produce photomosaic surveys to assess the bleaching’s extent.
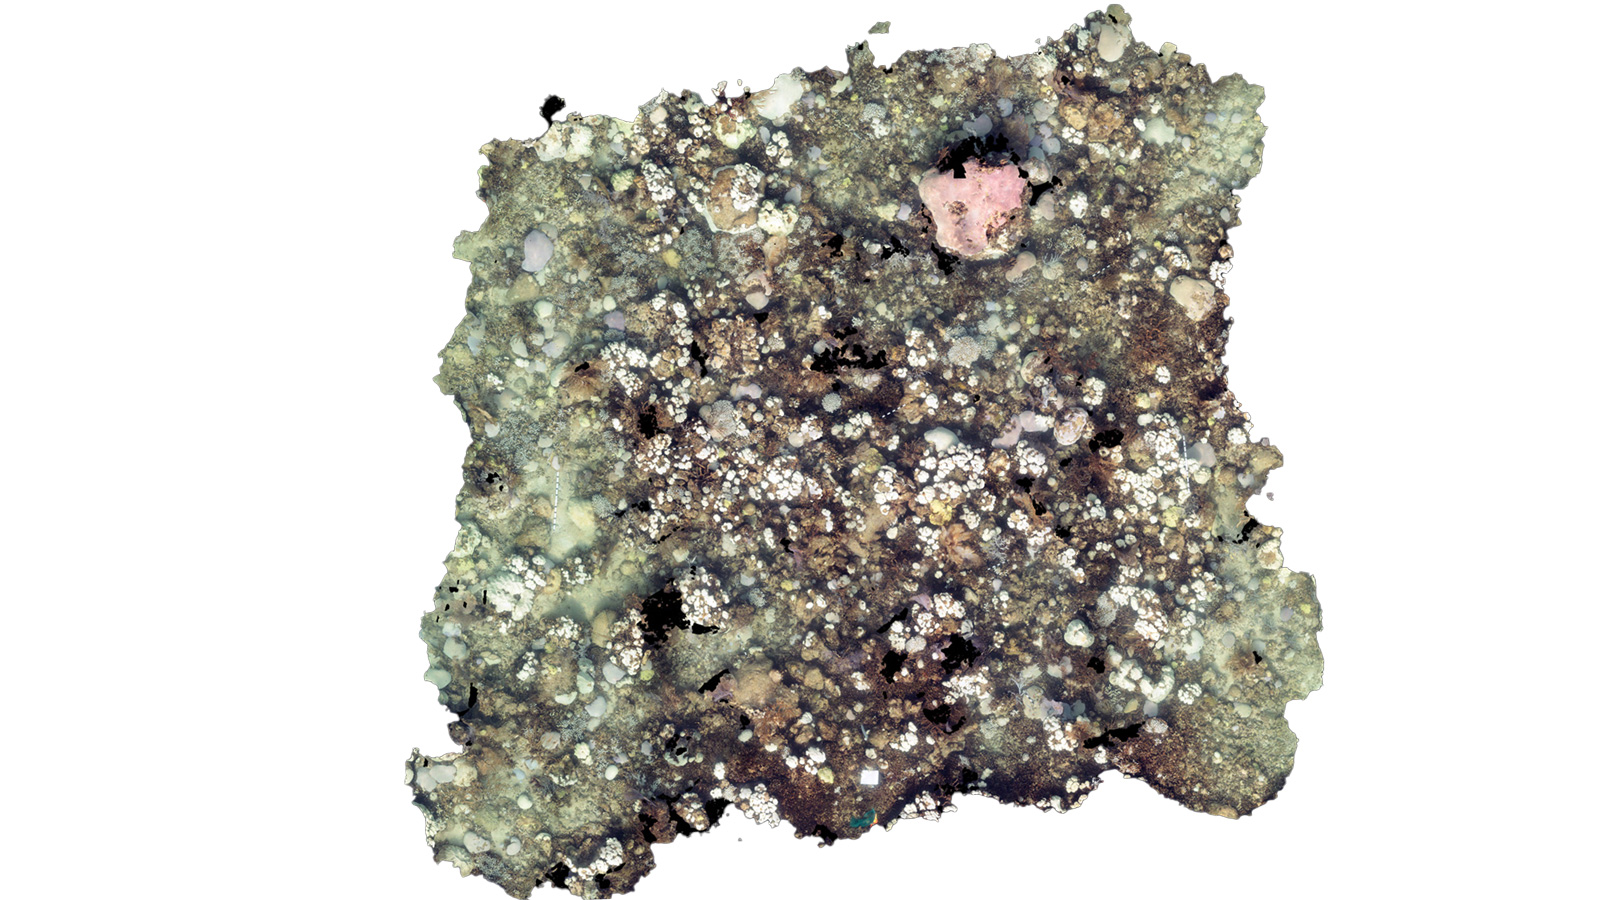 Cheeca Rocks Orthomosaic Model (Post-Bleaching)
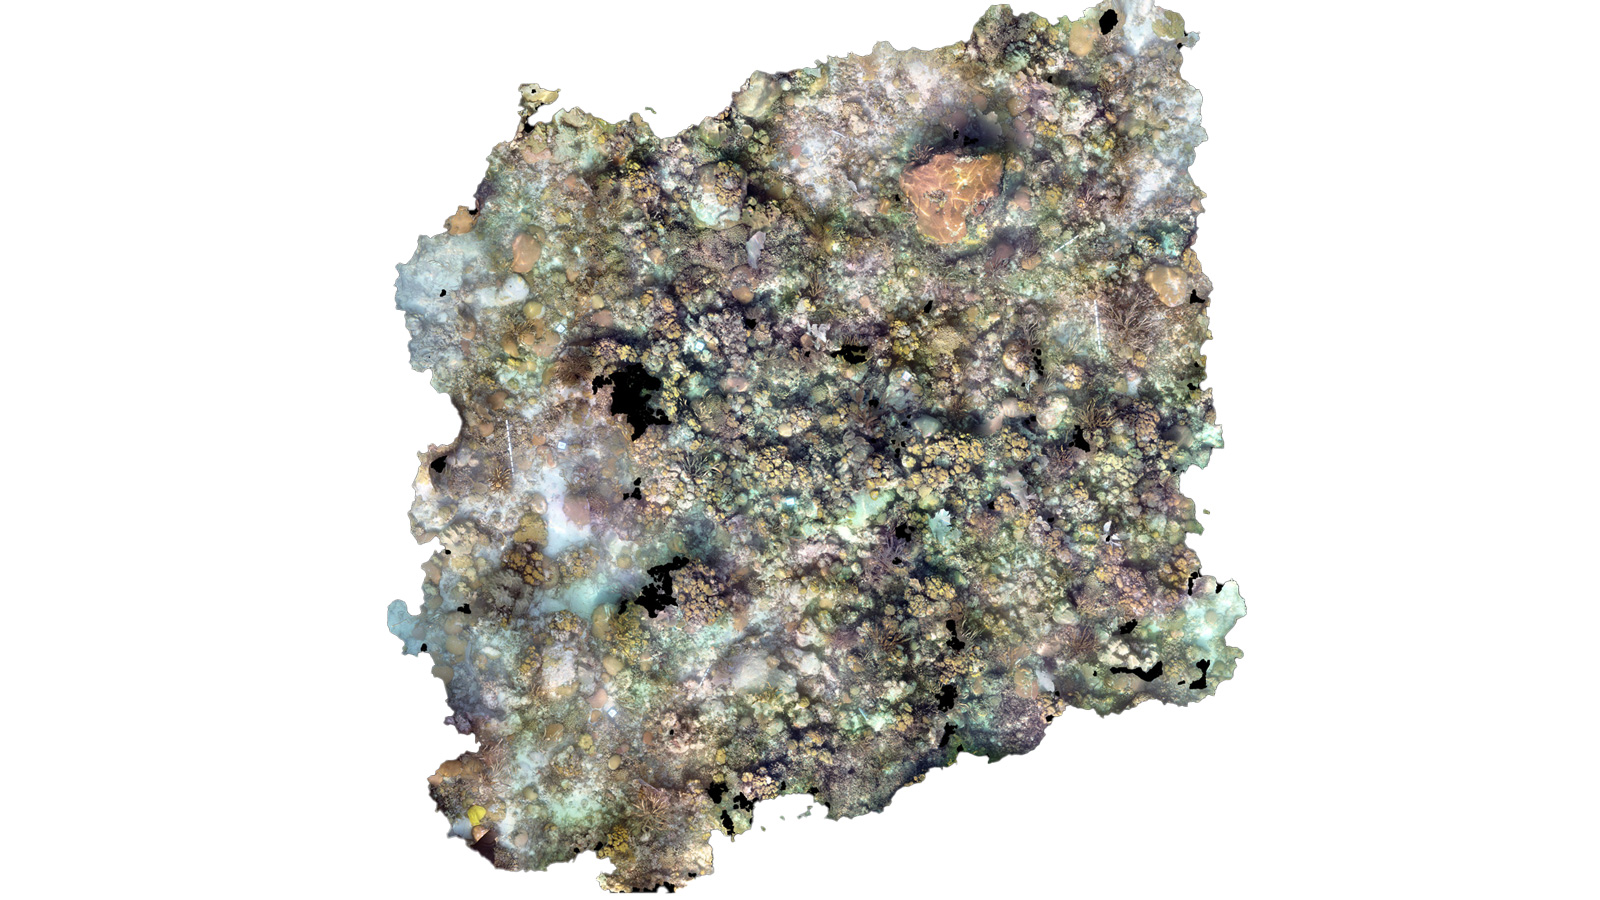 Cheeca Rocks Orthomosaic Model (Pre-Bleaching)
")
Continued assessment following the 2023 bleaching event further aides our ability to track coral recovery with high resolution images and state-of-the-art technology, advancing our knowledge of coral’s resilience through ground-breaking innovation.
Research Impacts & Key Findings
The applications of these technologies are limitless, and inform such interests as genotypic variabilities in growth rates of organisms in certain environmental conditions, spatial interactions between species through time, and differences in densities of skeletons of corals from different locales, all of which advance scientific understanding with the goal of informing management decisions.
Structure-From-Motion (SFM) Photogrammetry provides fine-scale spatial data for coral reef and sponge communities prior to channel dredging, coral interventions, and other adaptive management efforts. The combined approach of diver-based surveys and photogrammetry support long-term monitoring and restoration efforts over space and time.
Featured Publications
Spatiotemporal Variation in Coral Assemblages and Reef Habitat Complexity among Shallow Fore-Reef Sites in the Florida Keys National Marine Sanctuary
Kayelyn R. Simmons, DelWayne R. Bohnenstiehl and David B. Eggleston
With the unprecedented degradation and loss of coral reefs at multiple scales, the underlying changes in abiotic and biotic features relevant to the three-dimensional architecture of coral reefs are critical to conservation and restoration. This study characterized the spatiotemporal variation of habitat metrics at eight fore-reef sites representing three management zones in the Florida Keys, USA using visual habitat surveys (2017–2018) acquired before and after Hurricane Irma. Post-hurricane, five of those sites were surveyed using structure-from-motion photogrammetry to further investigate coral morphology on structural complexity. Multivariate results for visual surveys identified moderate separation among sites, with fished sites characterized by complex physical features such as depth and vertical hard relief while protected sites generally harbored high abundances of live coral cover.
Download the Full Paper: https://doi.org/10.3390/d14030153

Computed Tomography:
Manzello, D., Enochs, I.C., Kolodziej, G., Carlton, R. “Coral growth patterns of Montastrea cavernosa and Porites astreoides in the Florida Keys: The importance of thermal stress and inimical waters.” Journal of Experimental Marine Biology and Ecology 471, 198 – 207 (2015). https://doi.org/10.1016/j.jembe.2015.06.010
Manzello, D., Enochs, I.C., Kolodziej, G., Carlton, R. “Recent decade of growth and calcification of Orbicella faveolata in the Florida Keys: an inshore-offshore comparison.” Marine Ecology Project Series 521, 81-89 (2015). doi: 10.3354/meps11085
Groves, S.H., Holstein, D.M., Enochs, I.C. et al. “Growth rates of Porites astreoides and Orbicella franksi in mesophotic habitats surrounding St. Thomas, US Virgin Islands.” Coral Reefs 37, 345–354 (2018). https://doi.org/10.1007/s00338-018-1660-7
Enochs, I., et al. “Volcanic Acidification of a Coral Reef at Maug Island: Influences on Biological Processes and Ecosystem Structure.” American Geophysical Union (2016): AH52A-02. https://ui.adsabs.harvard.edu/abs/2016AGUOSAH52A..02E
3D Scanning:
Enochs, I.C., et al. “The influence of diel carbonate chemistry fluctuations on the calcification rate of Acropora cervicornis under present day and future acidification conditions.” Journal of Experimental Marine Biology and Ecology 506, 135 – 143 (2018). https://doi.org/10.1016/j.jembe.2018.06.007
Photogrammetry:
Gintert, B.E., Manzello, D.P., Enochs, I.C. et al. “Marked annual coral bleaching resilience of an inshore patch reef in the Florida Keys: A nugget of hope, aberrance, or last man standing?.” Coral Reefs 37, 533–547 (2018). https://doi.org/10.1007/s00338-018-1678-x
Simmons, K.R., Bohnenstiehl, D.R., Eggleston, D.B. “Spatiotemporal Variation in Coral Assemblages and Reef Habitat Complexity among Shallow Fore-Reef Sites in the Florida Keys National Marine Sanctuary.” Diversity 2022, 14, 153. https://doi.org/10.3390/d14030153
Looking for Literature? Search our Publication Database.
Funding Sources and Partners


