R/V Henry B. Bigelow Underway pCO2 Data
SCROLL TO LEARN MORE
Who We Are

| Rik Wanninkhof, Ph.D.
Senior Technical Scientist

| Denis Pierrot, Ph.D.
Oceanographer
About the Henry B. Bigelow
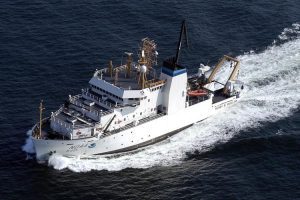 The NOAA ship Henry B. Bigelow, one of four new NOAA fisheries survey ships, was launched on July 8, 2005 in Pascagoula, Mississippi. The Henry B. Bigelow is a state-of-the-art research vessel and carries equipment and instrumental systems to conduct fisheries, oceanographic, and hydrographic research. The Henry B. Bigelow operates primarily in the North Atlantic Ocean from North Carolina to Maine. For more information on the NOAA Ship Henry B. Bigelow, follow the link to its homepage.
In 2011, the Ocean Carbon Cycle (OCC) group at NOAA’s Atlantic Oceanographic and Meteorological Laboratory (AOML) installed an automated system to measure surface pCO2 in the dry lab aboard the Henry B. Bigelow. The installation was greatly facilitated by the cooperation of the ship’s officers and crew, especially the survey and electronic technicians who provide on-going care. While the ship conducts the research that is the focus of a cruise, the pCO2 instrument takes 5 air and 70 water measurements every 3.4 hours. Data files are sent to AOML via email every day so that the system operation can be monitored. The final data are processed after a cruise is completed and then posted to international databases and to this web site.
About the Website
This web site provides access to the fugacity of CO2 (fCO2) data collected on this ship. Note, fCO2 is the partial pressure pCO2 corrected for non-ideality of the CO2 gas; they are numerically similar (fCO2 ≃ 0.995 pCO2). The processed data are organized by year and by cruise. For each cruise, the color coded fCO2 values are plotted along the ship’s cruise track on a chart. Next to each chart are links to the comma-delimited data file and the associated Readme file. To download a data file, select the year from the drop-down list box and click. Choose a chart and cruise, right-click on the link to its data file or Readme file, and select the download option. Please consult with and acknowledge the AOML Ocean Carbon Cycle group if data is used for publication or presentation (contacts in Master Readme, or Denis.Pierrot@noaa.gov).
The Master Readme provides meta data that is applicable for all data gathered from this ship. The individual Readme files next to the charts provide meta data specific to the associated cruise. The Real-Time Display link displays plots of the raw xCO2 data as a function of time and location. These plots are suitable for monitoring but are not suitable for environmental interpretation since the Real-Time data has not been processed nor quality controlled.
Henry B. Bigelow Underway pCO2 Data
- +Choose Data by Year
- Henry B.Bigelow 2011 Data
Henry B.Bigelow 2012 Data
Henry B.Bigelow 2013 Data
Henry B.Bigelow 2014 Data
Henry B.Bigelow 2015 Data
Henry B.Bigelow 2016 Data
Henry B.Bigelow 2017 Data
Henry B.Bigelow 2018 Data
Henry B.Bigelow 2019 Data
Henry B.Bigelow 2020 Data
Henry B.Bigelow 2021 Data
Henry B.Bigelow 2022 Data
Henry B.Bigelow 2023 Data
Henry B.Bigelow 2024 Data
Henry B. Bigelow Master Readme
Introduction
The information presented in this file is applicable to all the data sets collected on the R/V Henry B. Bigelow that are presented on this page.
Any temporary changes in this information will be noted in the readme files for the individual expeditions.
Statement for use of data:
These data are made available to the public and the scientific community in the belief that their wide dissemination will lead to greater understanding and new insights. The availability of these data does not constitute publication of the data. We rely on the ethics and integrity of the user to ensure that the AOML ocean carbon group receives fair credit for its work. Please consult with us prior to use so we can ensure that the quality and limitations of the data are accurately represented.
Platform Information:
In February 2011, the Ocean Carbon Cycle Group at NOAA’s Atlantic Oceanographic and Meteorological Laboratory (AOML) installed an instrument to measure CO2 levels in surface water and air on the NOAA Ship Henry B. Bigelow. The Bigelow primarily operates in the North Atlantic Ocean between North Carolina and Maine.
Vessel Name: Henry B. Bigelow
Class of Data: Surface ocean carbon dioxide concentrations
Scientists responsible for the technical quality of this pCO2 dataset:
Rik Wanninkhof and Denis Pierrot
NOAA/AOML/Ocean Chemistry and Ecosystems Division
4301 Rickenbacker Causeway
Miami, FL 33149
Rik.Wanninkhof@noaa.gov
Denis.Pierrot@noaa.gov
Contact persons for this dataset:
Denis Pierrot
NOAA/AOML/Ocean Chemistry and Ecosystems Division
4301 Rickenbacker Causeway
Miami, FL 33149
Denis.Pierrot@noaa.gov
Component Specifications and Accuracies
The accuracies of all components, when operating optimally, are such that the calculated seawater fCO2 has an accuracy of 2 uatm or better and the calculated mole fraction of CO2 (XCO2) in air has an accuracy of 0.1 uatm.
Infrared Analyzer:
LI-COR model 6262 (February 2011 – present)
Licor_6262_Manual.pdf
CO2 resolution: 0.01 umol/m
CO2 accuracy: ±1ppm at 350 ppm
Equilibrator Pressure:
Setra model 270, absolute pressure at analyzer exit (February 2011 – present)
http://www.setra.com/ProductDetails/270_Baro.htm
Resolution: 0.015 hPa
Accuracy: ±0.15 hPa
(manufacturer specifications: ±0.05% FS, where FS = 80-110 kPa)
Setra model 239, differential pressure at equilibrator headspace (February 2011 – present)
http://www.setra.com/ProductDetails/model_239.htm
Resolution: 0.01 hPa
Accuracy: ±0.052 hPa
(manufacturer specifications: ±0.14% FS, where FS = ±7.5 inches WC)
The absolute pressure of the equilibrator headspace reported in data files is the sum
of the differential pressure from the pressure transducer attached to the equilibrator
and the absolute pressure measured at the analyzer exit to the space surrounding the
instrument.
Equilibrator Temperature:
Hart model 1523 (February 2011 – present)
http://www.testequipmentdepot.com/fluke-calibration/pdfs/1523-1524_data.pdf
Accuracy: ±0.021°C
Resolution: 0.001°C
Sea Surface Salinity and Temperature (maintained by ship):
SeaBird model SBE-45 (February 2011-present)
http://www.seabird.com/pdf_documents/manuals/45_017.pdf
Temperature resolution: 0.0001°C
Temperature accuracy: ±0.002°C
Salinity resolution: 0.0002‰
Salinity accuracy: ±0.005‰
SeaBird model SBE-38 (February 2011 – present)
http://www.seabird.com/pdf_documents/manuals/38_013.pdf
Temperature resolution: 0.00025°C
Temperature accuracy: ±0.001°C
Atmospheric Pressure (maintained by ship):
Vaisala model PTB220 barometer (February 2011 – present)
http://www.seatronics-group.com/assets/
uploads/resources/2010/3/72c50364-31f6-446f-abe4-ecabc5ad7a9a.pdf
Resolution: 0.01 hPa
Accuracy: ±0.15 hPa
Instrument Description and Configuration
The general principle of operation of the instrument can be found in Wanninkhof and Thoning (1993), Ho et al. (1995), Feely et al. (1998), and Pierrot et al. (2009). Seawater flows through an equilibrator chamber where CO2 exchanges between water and the air above it. Small changes in seawater CO2 concentration are rapidly translated into changes in CO2 concentration in the air of the chamber (headspace). The mole fraction of CO2 in the headspace gas is measured using a non-dispersive infrared (NDIR) analyzer from LICOR®.
The effects of water vapor on the sample analyses are kept to a minimum by removing as much water as possible. The water is first condensed out of the sample gas stream by cooling to ~5 °C using a thermoelectric device. Then water is further removed using Nafion® gas dryers before reaching the IR analyzer. The counterflow gas in the dryer is pre-dried outside air. Typical water content of the analyzed gas is less than 3 millimoles/mole with approximately 90% of the water being removed.
The infrared analyzer is calibrated regularly using four standard gases (200 – 550 ppm CO2 in air) from Scott-Martin Inc. (Riverside, CA). Before and after use in the field, the standards are calibrated using primary reference gases from the laboratory of Dr. Charles D. Keeling, which are directly traceable to the WMO scale. A zero gas of ultra-high purity air is analyzed regularly. Any value outside the range of the standards should be considered approximate (+/-5 ppm). While individual data points above the highest standard or below the lowest standard may less accurate, the general trends would be indicative of the seawater chemistry. The standards used on a particular cruise are listed in the individual readme file.
The system also measures the CO2 content of the atmospheric air, which is drawn from an inlet on the mast above the bridge. Atmospheric air is constantly being pulled (6 liters/min maximum flow) through ~35 meters of tubing (1 cm OD Dekoron) to the analytical system located in the dry lab. The flushing rate of the LI-COR analyzer during ATM analyses is 60-150 ml/min.
The dedicated scientific seawater system has two inlets (3m and 5m depth), with the deeper inlet only being used occasionally in rougher weather. A remote temperature sensor (SBE38) is located near the sea water pump in the engine room for in-situ sea surface temperature (SST) measurements. A thermosalinograph (SBE45) and a fluorometer are located next to the CO2 instrument in the dry lab. The seawater travels from the inlet to the CO2 instrument in less than one minute.
Seawater is pushed through a spray head into an equilibration chamber that includes a water jacket for better thermal stability (optional on the General Oceanics model 8050 system). The chamber had a 0.6 L water reservoir and a 0.8 L gaseous headspace. Water flow rate is 1.2-1.8 L/min. The rate that the headspace gas is recirculated through the analyzer during EQU analyses is ~60 – 150 ml/min.
The ship provides serial connections for GPS locations and times and for an array of oceanographic and meteorological parameters (e.g. SST, salinity, atmospheric pressure). These supporting data are appended to the CO2 data records in real-time. The CO2 data is transmitted back to land each day.
A typical sequence of continuous analyses is:
STEP TYPE REPETITIONS
1 – Standards (all four) – 1
2 – ATM – 5
3 – EQU – 70
With these settings, a complete set of standards and the atmospheric analyses are done every 3 hours and a full day contains about 480 analyses of the equilibrator headspace.
Calculations
The measured xCO2 values are linearly corrected for instrument response using the standard measurements (see Pierrot et al., 2009).
For ambient air and equilibrator headspace the fCO2a or fCO2eq is calculated assuming 100% water vapor content:
fCO2 = xCO2 P (1-pH2O) exp[(B11+2d12)P/RT]
where fCO2 is the fugacity in ambient air or equilibrator headspace, pH2O is the water vapor pressure at the sea surface or equilibrator temperature, P is the equilibrator or
outside atmospheric pressure (in atm), T is the SST or equilibrator temperature (in K) and R is the ideal gas constant (82.057 cm^3·atm·deg^-1·mol^-1). The exponential term is the fugacity correction where B11 is the first virial coefficient of pure CO2
B11 = -1636.75 + 12.0408 T – 0.0327957 T^2 + 3.16528E-5 T^3
and
d12 = 57.7 – 0.118 T</span?
is the correction for an air-CO2 mixture in units of cm^3·mol^-1 (Weiss, 1974).
The fugacity as measured in the equilibrator is corrected for any temperature difference between sea surface temperature and equilibrator chamber using the empirical correction outlined in Takahashi et al. (1993).
fCO2(SST) = fCO2(teq)exp[0.0423(SST-teq)]
where fCO2(SST) is the fugacity at the sea surface temperature and fCO2(teq) is the fugacity at the equilibrator temperature. SST and teq are the sea surface and equilibrator temperatures in degrees C, respectively.
The amount of time between the sea water passing by the SST (SBE38) sensor and the water flowing through the equilibrator is estimated before assigning an SST value to each analysis. The patterns in the temperature records for the equilibrator and for SST over time are compared, and a time offset that optimizes the match of these patterns is determined. The time offset is applied to the SST measurements. A linear interpolation between the time-adjusted SST data yields the SST value assigned to each CO2 analysis and used in the fugacity calculations.
Data File Structure
List of variables included in this dataset:
COLUMN
HEADER
EXPLANATION
1.
EXPOCODE
Expedition code, where ’33HH’ is the NODC ship identifier, and YYYYMMDD is the UTC date that the ship starts the expedition
2.
Group_Ship
AOML_HenryB.Bigelow, (if present)
3.
Cruise_ID
Dependent upon expedition’s name, (if present)
4.
YD_UTC
Decimal year day
5.
DATE_UTC_ddmmyyyy
UTC Date
6.
TIME_UTC_hh:mm:ss
UTC Time
7.
LAT_dec_degree
Latitude in decimal degrees (negative values are in southern hemisphere)
8.
LONG_ dec_degree
Longitude in decimal degrees (negative values are in western hemisphere)
9.
xCO2_EQU_ppm
Mole fraction of CO2 in the equilibrator headspace (dry) at equilibrator temperature, in parts per million
10.
xCO2_ATM_ppm
Mole fraction of CO2 in the equilibrator headspace (dry) at equilibrator temperature, in parts per million
11.
xCO2_ATM_interpolated_ppm
xCO2 in outside air associated with each water analysis. These values are interpolated between the bracketing averaged good xCO2_ATM analyses, in parts per million, (if present)
12.
PRES_EQU_hPa
Barometric pressure in the equilibrator headspace, in hectopascals (1 hPa = 1 millibar)
13.
PRES_ATM@SSP_hPa
Pressure measured by outside barometer, corrected to sea level, in hectopascals
14.
TEMP_EQU_C
Water temperature in equilibrator, in degrees centigrade
15.
SST_C
Sea surface temperature from the ship’s temperature sensor, in degrees centigrade [interpolated, see note above]
16.
SAL_permil
Salinity from the thermosalinograph (SBE45), on the Practical Salinity Scale
17.
fCO2_SW@SST_uatm
Fugacity of CO2 in sea water, in microatmospheres (100% humidity)
18.
fCO2_ATM_interpolated_uatm
Fugacity of CO2 in air corresponding to the interpolated xCO2, in microatmospheres (100% humidity), (if present)
19.
dfCO2_uatm
Sea water fCO2 minus interpolated air fCO2, in microatmospheres, (if present)
20.
WOCE_QC_FLAG
Quality control flag for fCO2; values (2 = good value, 3 = questionable value)
21.
QC_SUBFLAG
Quality control sub flag for fCO2 values provides explanation for atypical data, when QC_FLAG = 3
The quality control flags are provided as an aid to the interpretation of the CO2 data. Stringent minimum and maximum values for numerous parameters (e.g.temperature difference between the equilibrator temperature and SST) have been established by CO2 researchers (see Pierrot et al., 2009). These ranges were chosen so that if each parameter were within their stringent range, the resulting CO2 data would almost certainly be good. If a parameter is outside its range or if a parameter is estimated from surrounding good values, the quality flag of that data record is set to 3 (questionable value). The resulting CO2 data could be good; however, investigators should determine whether these data are valid for their purposes.
References
DOE (1994). OE (1994). Handbook of methods for the analysis of the various parameters of the carbon dioxide system in sea water; version 2. DOE.
Feely, R. A., R. Wanninkhof, H. B. Milburn, C. E. Cosca, M. Stapp and P. P. Murphy (1998). A new automated underway system for making high precision pCO2 measurements onboard research ships. Analytica Chim. Acta 377: 185-191.
Ho, D. T., R. Wanninkhof, J. Masters, R. A. Feely and C. E. Cosca (1997). Measurement of underway fCO2 in the Eastern Equatorial Pacific on NOAA ships BALDRIGE and DISCOVERER, NOAA data report ERL AOML-30, 52 pp., NTIS Springfield.
Pierrot, D., C. Neill, K. Sullivan, R. Castle, R. Wanninkhof, H. Luger, T. Johannessen, A. Olsen, R. A. Feely, and C. E. Cosca (2009). Recommendations for autonomous underway pCO2 measuring systems and data-reduction routines. Deep Sea Research II, 56: 512-522.
Wanninkhof, R. and K. Thoning (1993) Measurement of fugacity of CO2 in surface water using continuous and discrete sampling methods. Mar. Chem. 44(2-4): 189-205.
Weiss, R. F. (1970). The solubility of nitrogen, oxygen and argon in water and seawater. Deep-Sea Research 17: 721-735.
Weiss, R. F. (1974). Carbon dioxide in water and seawater: the solubility of a non-ideal gas. Mar. Chem. 2: 203-215.
Weiss, R. F., R. A. Jahnke and C. D. Keeling (1982). Seasonal effects of temperature and salinity on the partial pressure of CO2 in seawater. Nature 300: 511-513.
Takahashi, T., J. Olafsson, J. G. Goddard, D. W. Chipman, and S. C. Sutherland (1993). Seasonal variation of CO2 and nutrients in the high-latitude surface oceans: a comparative study, Global Biogeochem. Cycles, 7, 843-878.