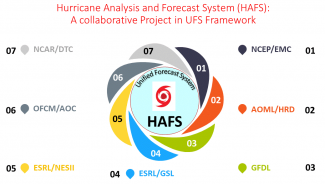
The new Hurricane Analysis and Forecast System (HAFS) became operational (i.e., used by the National Hurricane Center in their official forecasts) for the 2023 hurricane season. HAFS was run during the 2022 hurricane season in the Atlantic and East Pacific to test it before designing the final version. We found encouraging track forecasts results, including notable improvement over currently operational models like the Hurricane Weather Research and Forecasting (HWRF) model. We also found areas that HAFS could be improved prior to the operational implementation, and helped to make those changes.

The 2022 hurricane season provided an opportunity to test a new hurricane model, called HAFS, prior to it becoming an operational hurricane model during the 2023 hurricane season. We focused on a version called HAFS-Secondary (HAFS-S, nowHAFS-B), which featured some improvements to the microphysics (the processes driving the evolution of clouds in the model) and the boundary layer (lowest layer of the atmosphere) physics, since these are important drivers of the energy in tropical cyclones. HAFS-S performed very well relative to current models for forecasts of where the tropical cyclone (TC) will go, especially in the East Pacific. The intensity forecast results were mixed (sometimes worse, sometimes better than current models), although they were generally better than current models in the East Pacific. HAFS-S also had fairly accurate forecasts of the TC size, although it sometimes forecast the TC to be too small. A detailed look at Hurricane Ian highlighted HAFS-S’ performance for one of the most impactful cases of the 2022 season, including an accurate prediction of Ian’s rapid intensification in the Gulf of America.

Conclusions and Findings:
One of the most consistent findings from our 2022 real-time experiment was that HAFS-S (and another experimental version of HAFS, HAFS-A) performed well on track forecasts. Figure 1 shows the East Pacific track forecast errors for HAFS-A, HAFS-S, and the two operational hurricane models (HWRF and HMON). HAFS-S had the best track forecast performance, with HAFS-S a close second, especially for long-range forecasts (Days 4-5).
On the other hand, intensity forecasts were a mixed bag, including forecasts of rapid intensification (when a system intensifies by at least 30 knots in 24 hours). As seen in Figure 2, HAFS-S performed better than HWRF and HMON (and similarly to HAFS-A) in the East Pacific, but slightly worse than HWRF and HMON in the Atlantic. It was notably better than HAFS-A in the Atlantic, however, thanks to the physics changes that were implemented in this version of HAFS.
Hurricane Ian illustrated some of both the strengths and weaknesses of the 2022 HAFS-S forecasts. Figure 3 shows all the track and intensity forecasts for Ian for HAFS-S. When Ian turned to the northwest, the forecasts were too far left, consistent with some of the other hurricane model forecasts for Ian. However, the forecasts improved in time, and many of the forecasts correctly showed Ian intensifying into an extremely powerful storm in the Gulf of America prior to landfall.
For more information, contact aoml.communications@noaa.gov. The paper can be found at https://www.frontiersin.org/articles/10.3389/feart.2023.1264969/abstract.
