Summary: To warn people who are in harm’s way from a tropical cyclone (TC), not only is it important to know where it is going and how strong it will be, but also how large it is. We usually measure that by looking at how far away from the center of the TC wind of a certain strength occurs, what are called wind radii. The wind radii are also used to initialize computer models to get the best forecasts.
The spaceborne Synthetic Aperture Radar (SAR) and radiometer can frequently measure the surface wind in a TC over large areas and with good accuracy. Unlike satellites that take pictures of the earth and cannot see through clouds, the SAR and radiometer can see through clouds and measure the TC day and night.

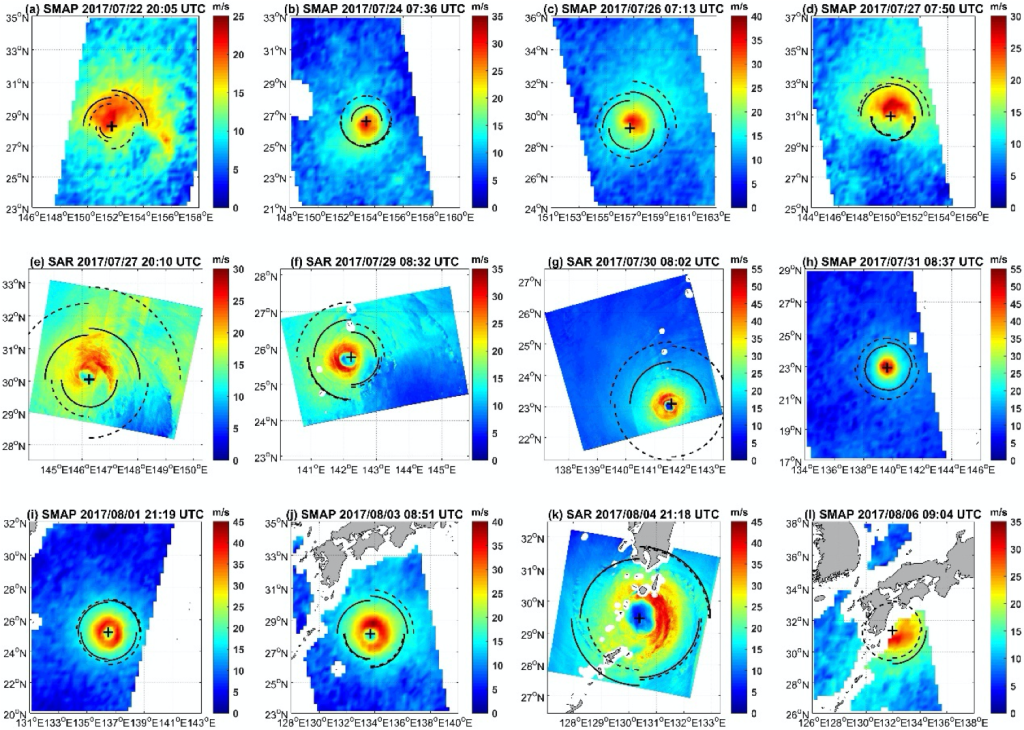
This study presents a simple method to estimate 34-, 50- and 64-kt wind radii (R34, R50, R64) and maximum wind speed (Vmax) from the L-band Soil Moisture Active Passive radiometer and C-band Sentinel-1A/B and RADARSAT-2 SAR measurements. It compares these estimates to the best estimates of them from other sources (the best-track data).

Important Conclusions:
1. The differences between the new satellite-based values for R34, R50 and R64 and the best-track values are small. These values are smaller than the average uncertainty of the best-track estimates.
2. The differences between the new satellite-based values for storm intensity and the best track intensity average 0-4 m/s. These differences are possibly due to uncertainty in the best-track estimates, different ways that the maximum wind speed is measured, and characteristics of the satellite data.
3. The combination of the two types of data are valuable for studying small features in the TC and how the it varies around the TC, thing that are related to intensity changes. These can help correct how we start forecast models and forecast how the ocean below the TC reacts to the wind, and thus improve the forecasts.

For more information, contact aoml.communications@noaa.gov. You can see the study at https://ieeexplore.ieee.org/document/9380372
This work was supported in part by the NSFC–RSF Joint Project, the National Science Foundation of China, the Shanghai Typhoon Foundation, the International cooperation project of National Natural Science Foundation of China, the ESA-MOST China Dragon-5 Programme, the Government Research Initiative Program (GRIP) of the Canadian Space Agency, and the Ocean Frontier Institute of Dalhousie University, Fisheries and Oceans Canada SWOT program. Jun Zhang was supported by NOAA and NSF. The views, opinions, and findings contained in this paper are those of the authors personally and do not reflect any positions, policies, or decisions of Canada, U.S., and China government and agencies.
