**This project is complete. The page serves as an archive for work completed by AOML during and after the event in 2010.**
Monitoring the Gulf of America During the Deepwater Horizon Oil Spill
JUMP TO DATA OR SCROLL TO LEARN MORE
What We Did
As part of NOAA’s mission to study the role of the ocean in climate and ecosystems, scientists at AOML have been devising methods and tools to allow for the real-time monitoring of ocean conditions. Following the Deepwater Horizon explosion in April 2010, AOML organized a scientific response effort building upon these capabilities. This webpage was designed to provide data and graphical products about ocean currents, sea surface temperature, sea level, ocean color, and particle displacement, during and after the event. These data were obtained using direct ocean measurements, remote observations collected via satellite, and outputs from numerical models.
Scientists at AOML participated in spill related research panels, published scientific manuscript related to the ocean conditions during the oil spill, and led research cruises focused on assessing the extent of the spill in the greater Gulf of America and the potential for entrainment via the Loop Current to downstream ecosystems. AOML and NOAA’s Southeast Fisheries Science Center (SEFSC) also organized an oceanography workshop in Miami on July 1-2, 2010, where observations, methods, and strategies were discussed.

Satellite image of the Gulf of America, showing the location of the Deepwater Horizon spill site and the extent of the oil spill on April 20, 2010.
Ocean Conditions in the Gulf of America
These maps of ocean surface currents determined from satellite measurements provide information to scientists, decision makers, and emergency response personnel about the present oceanic flows and how they are changing with time.
The map to the right shows an estimate of the surface currents in the Gulf of America in August of 2010. The red star indicates the location of the Deepwater Horizon explosion. The solid red line indicates the location of the Loop Current and anticyclonic rings and eddies (red) and cyclonic eddies (blue).
SHA data source: US Global Ocean Data Assimilation Experiment (GODAE)
Currents produced by NOAA/AOML and NOAA/CoastWatch.

Surface Current Fields
To see an animation of the surface currents field during the Deepwater Horizon event, please select one of the months below:
Deepwater Horizon Oil Spill Monitoring
These instruments were used to monitor the Deepwater horizon oil spill during the summer of 2010. Click on the icons below to learn more.
XBT and CTD Observations
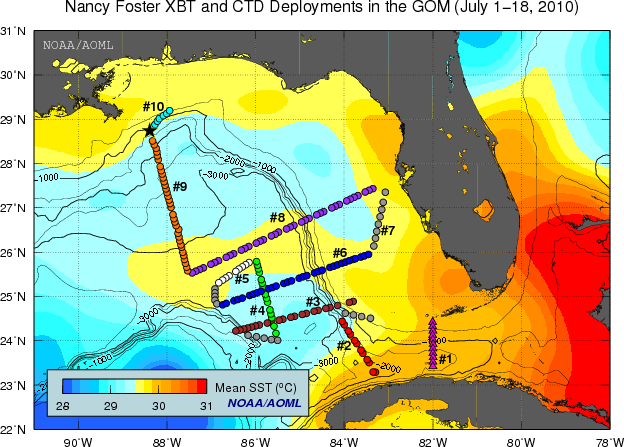
Temperature and Salinity Sections: July 1-18, 2010 (NOAA ship Nancy Foster)
The map to the right shows the location of eXpendable BathyThermograph (XBT) (circles) and Conductivity Temperature Depth (CTD) (triangles) observations carried out by AOML scientists onboard the NOAA ship Nancy Foster between July 1-18, 2010. The map also shows the mean sea surface temperature (SST, °C) for the previously mentioned dates, superimposed on the regional bathymetry (in meters). The location of the Deepwater Horizon rig is denoted by a star.
Nine temperature sections and six salinity sections were produced using the XBT and CTD profiles obtained by the scientists during their cruise in the Gulf of America. These sections can be viewed by clicking on the sections below. In all sections, the deployment locations of XBT and CTD are indicated by green and blue inverted triangles, respectively.
Section #1 at 82°W (magenta triangles)
Temperature: 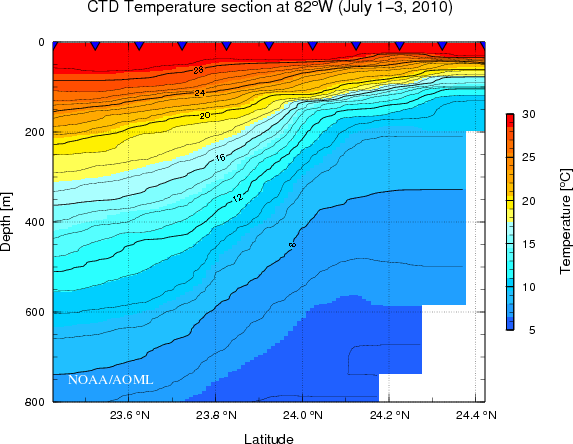
Salinity: 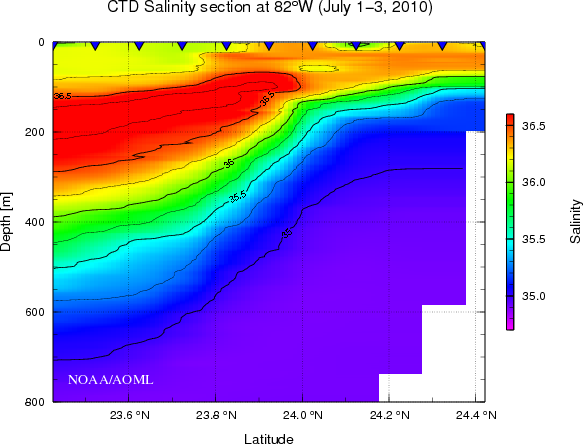
Section #2 at 83.7°W (red circles)
Temperature: 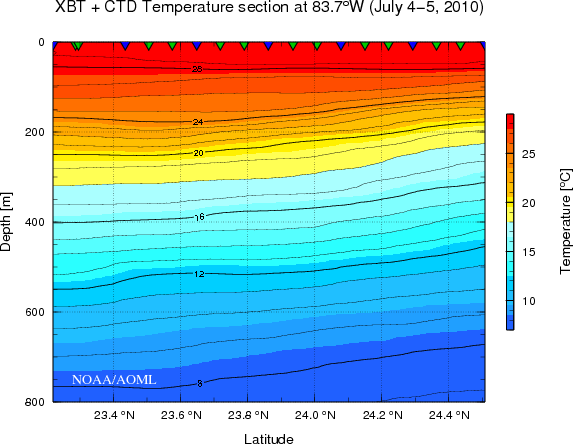
Salinity: 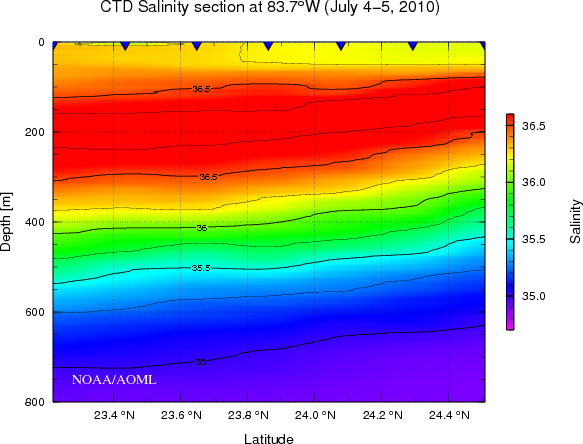
Section #3 at 24.7°N (brown circles)
Temperature: 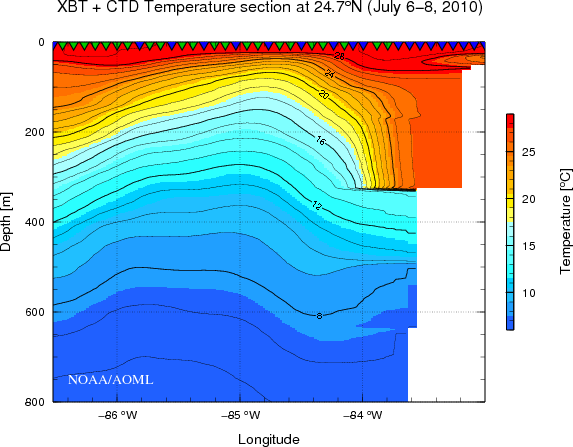
Salinity: 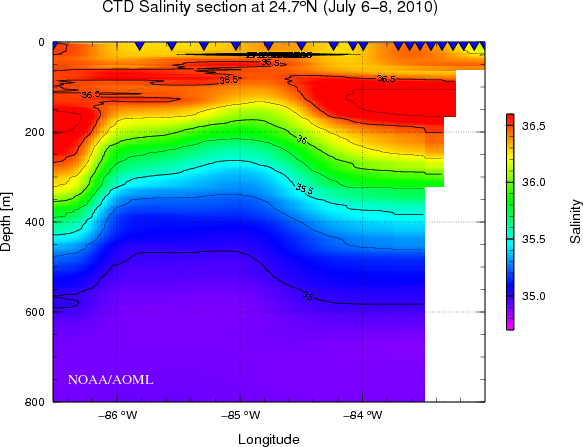
Section #4 at 85.8°W (green circles)
Temperature: 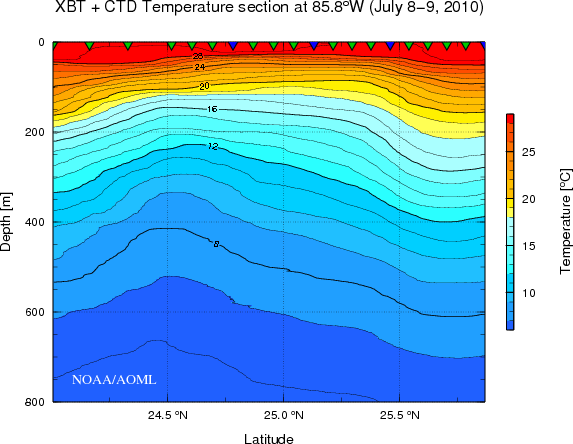
Salinity: 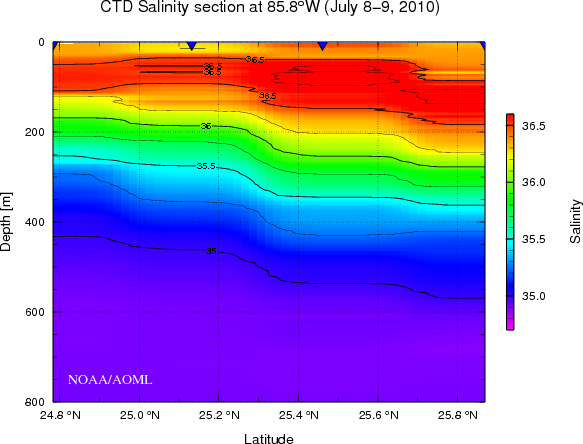
Section #5 at 25.5°N (white circles)
Temperature: 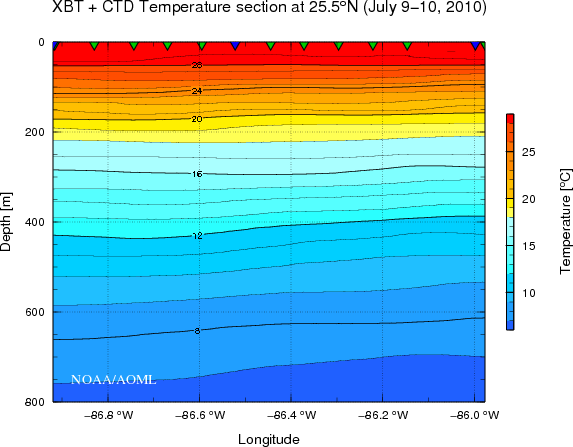
Section #6 at 25.5°N (blue circles)
Temperature: 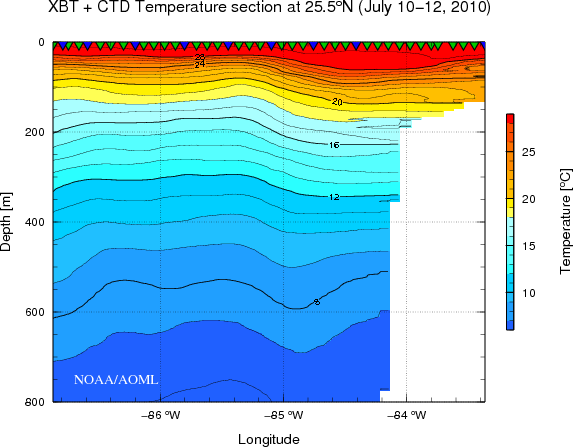
Salinity: 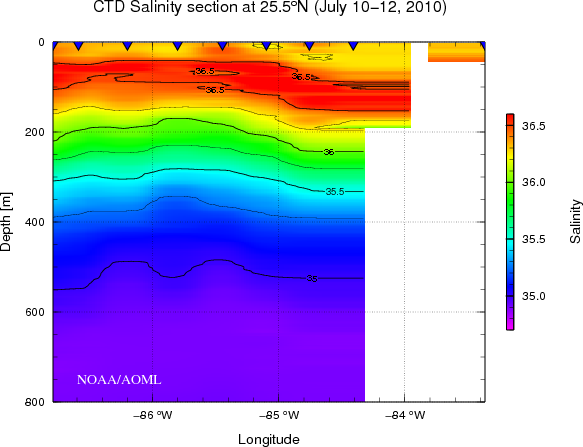
Section #8 at 26.5°N (purple circles)
Temperature: 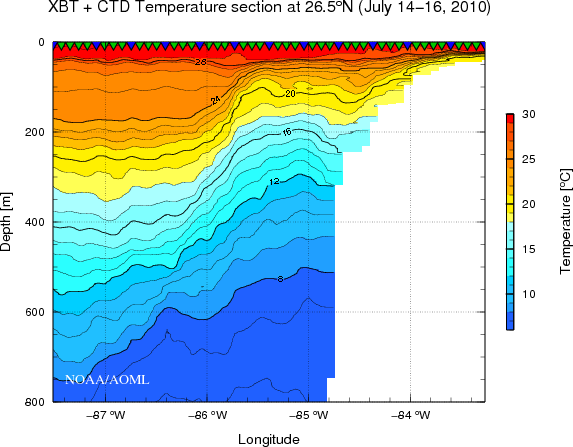
Salinity: 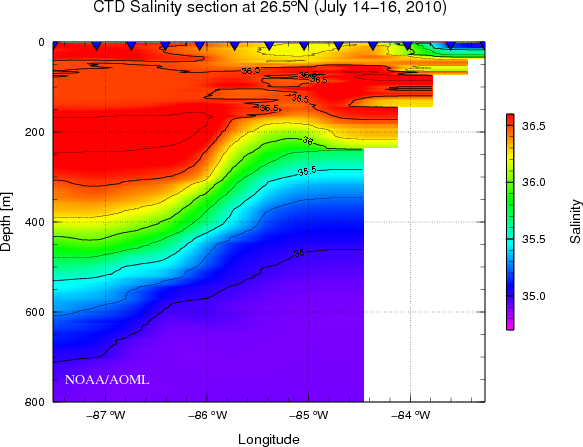
Section #9 at 88°W (orange circles)
Temperature: 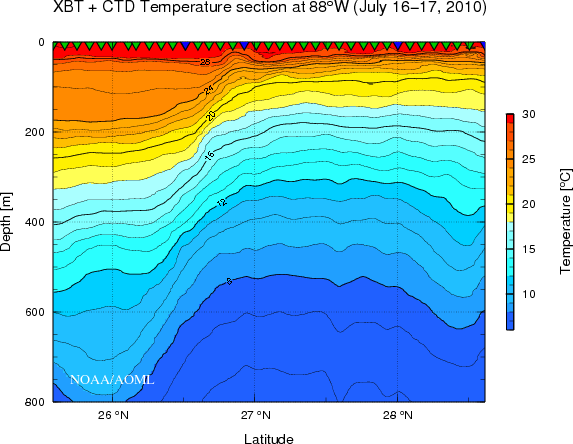
Section #10 at 88.2°W (cyan circles)
Temperature: 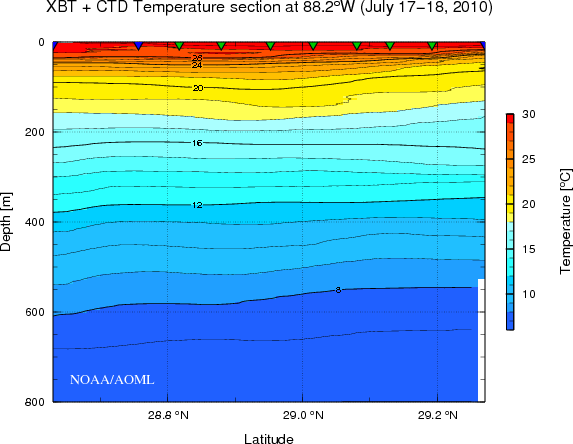
Temperature Sections for June 7-10, 2010 (R/V F.G. Walton Smith)
The map to the right shows the location of eXpendable BathyThermograph (XBT) observations (red, green and purple dots) deployed by AOML and University of Miami scientists onboard the R/V F.G. Walton Smith between June 7-10, 2010. The map also shows the mean sea surface temperature (SST, °C) for the previously mentioned dates, superimposed on the regional bathymetry (in meters). The location of the Deepwater Horizon rig is denoted by a star. Three temperature sections were produced using temperature profiles obtained by the scientists during their transit from Gulf Port, Mississippi to Miami, Florida, and these sections can be viewed by clicking on the observations listed here (section 1-red, section 2-green, and section 3-purple dots).
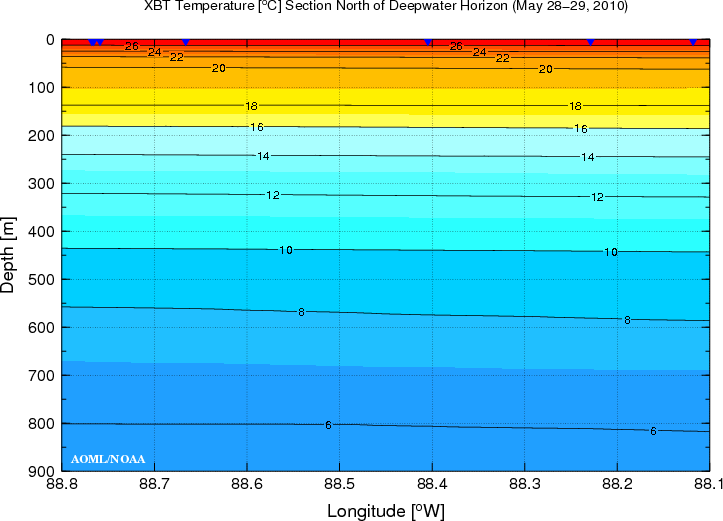
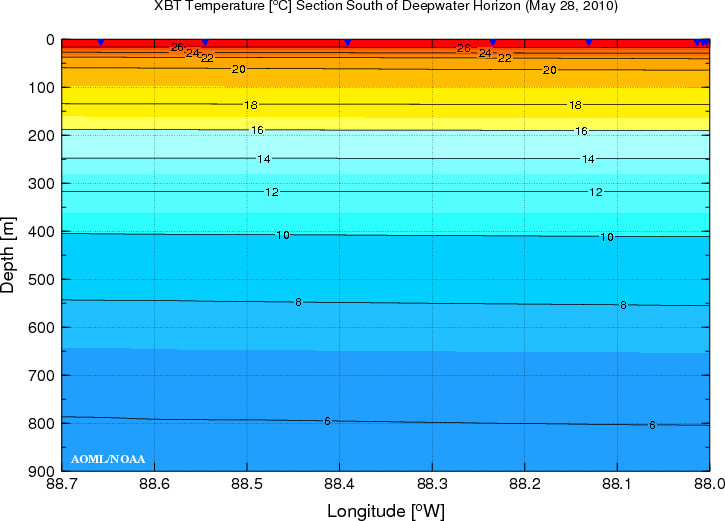
Temperature Sections for May 28-30, 2010 (NOAA Ship Gordon Gunter)
The map to the left shows the location of eXpendable BathyThermograph (XBT) deployments (red, purple and brown dots) by AOML scientists onboard the NOAA Ship Gordon Gunter, and the mean sea surface temperature (SST, °C) for May 28-30, 2010 superimposed on the regional bathymetry (in meters). The location of the Deepwater Horizon rig is denoted by a star.
The XBT probes were deployed in concentric patterns near the location of the Deepwater Horizon oil rig. Two temperature sections were produced using the temperature profiles from the outer circle, located north (red dots), and south (purple dots) of the sunken oil rig.
Data source for SST: Remote Sensing Systems
EXpendable Current Profiler (XCP) Observations
Velocity and Temperature Profiles
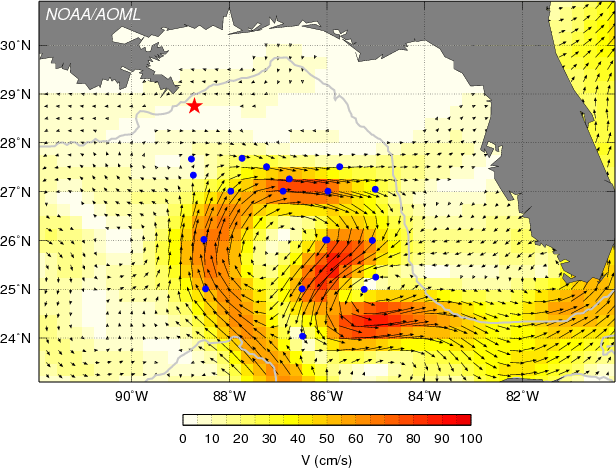
The map to the right shows the location of eXpendable Current Profiler (XCP) observations (blue dots) deployed by AOML and CIMAS scientists from a NOAA WP-3D aircraft between May 18-21, 2010. The map also shows the geostrophic surface velocity (vectors) and speed (colors) derived from satellite altimetry observations corresponding to the date of the survey. The location of the Deepwater Horizon rig is denoted by a red star. Nineteen profiles were collected over the Loop Current, shown by the large values of surface currents (orange and red colors).
Airborne EXpendable BathyThermograph (AXBT) Observations
Velocity and Temperature Profiles
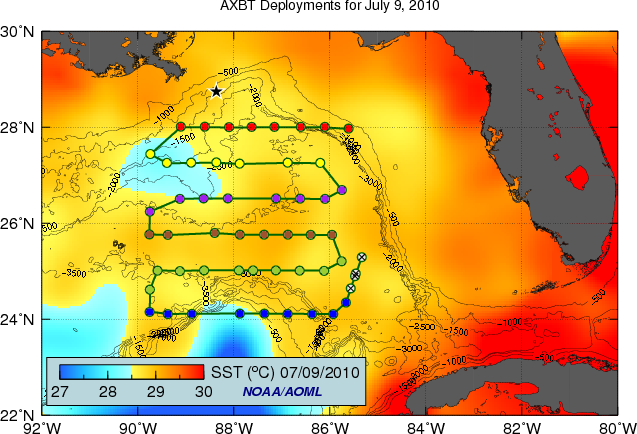
The location of Airborne EXpendable BathyThermograph (AXBT) deployments for July 9, 2010 are shown in the map to the left. The map also show the corresponding sea surface temperature (SST, °C) superimposed on the regional bathymetry (in meters). The location of the Deepwater Horizon is denoted by a star. Temperature sections for July 9, 2010 are found here: at 24°N (blue circles), 25°N (green circles), 25.75°N (brown circles), 26.5°N (purple circles), 27.2°N (yellow circles), and 28°N (red circles). Deployments denoted by white circles with crosshairs were omitted from the temperature sections.
To view all of the velocity and temperature profiles for AXBT’s deployed in response to the Deepwater Horizon spill, click the button below. Dates of each mission and the corresponding temperature sections can be viewed here. The location of AXBT deployments for each mission are shown in the maps with the corresponding sea surface temperature.
NOAA’s Global Drifter Program arranged for 36 drifters to be deployed in the Gulf of America in 2010 following the Deepwater Horizon spill. The data from these drifters were transmitted on the Global Telecommunication System for real-time distribution, and are available in ASCII format via ftp. These drifters were deployed in pairs, so that their relative spreading rates could be quantified. The trajectories of these drifters mapped the ocean features in the Gulf, like the warm ring and the Loop Current, and helped scientists understand and forecast where these features would carry the oil.
On June 7-9 2010, 6 drifter pairs were deployed from the R/V Walton Smith between the Deepwater Horizon site and the Dry Tortugas. The final two pairs were deployed close together in a convergence region where personnel aboard the Walton Smith observed oil being carried southward in a frontal jet. In July 2010, 12 drifter pairs were deployed from the R/V Nancy Foster. These deployments were concentrated in the Loop Current and the large eddies north and northwest of the current. For more deployment information please visit our Deployment Log page.


Simulated Flow Trajectories
Why are they helpful?
Numerical simulations of flow trajectories show how ocean currents spread particles released from a given location. These simulations are based on satellite observations or numerical simulations of ocean surface currents. The spreading of these particles approximates how oil will act below the ocean surface, where the effect of wind and sunlight are not that important, compared with the surface where discrepancies between these simulations and the spreading of oil are possible.
Lagrangian Coherent Structures
The map to the right shows an animation of the evolution of surface water particles (in black) released daily at the Deepwater Horizon location, overlaid on the finite-time Lyapunov exponent field (FTLE) for the corresponding date. Bands of most intense red tones indicate attracting Lagrangian Coherent Structures (LCS), which act as barriers for the moving particles. Consistent with this, please note that in these animations, the distribution of the simulated particles closely follow the deformation of the LCS over time. The velocity field used for these simulations were daily outputs of the IASNFS NCOM model (Navy Coastal Ocean Model). These maps are only available for the period of the oil spill.
Fieldwork & Research Cruises
Scientists from AOML’s Ocean Chemistry & Ecosystems and Physical Oceanography Divisions participated in a number of research cruises, conferences, and provided substantial scientific support for NOAA’s response to the Deepwater Horizon oil spill. AOML also supplied instrumentation for NOAA vessels, quality control for Winkler titrations needed to calibrate oxygen sensors, and contributed to studies of oil distribution in beach and coral reef regions of Florida.
Working with colleagues from EPA, NOAA-ORR, the University of South Florida, Louisiana State University, Canada’s Dept. of Fisheries and Oceans, the Alliance for Coastal Technology, Dalhousie University, the Oil Spill Recovery Institute, and several corporations, former Ocean Chemistry and Ecosystems Director Michelle Wood organized a study at DFO’s Center for Offshore Oil and Gas Energy Research to evaluate the sensitivity and linearity of response for different flourometers used to detect subsurface oil during the Deepwater Horizon event.

Dr. Michelle Wood, Director of AOML’s Ocean Chemistry and Ecosystems Division was Chief Scientist and Mr. Charles Featherstone of the Ocean Chemistry and Ecosystems Division provided scientific support in the R/V Walton Smith Deepwater Horizon Cruise, June 6 – June 10, 2010. [Mission Report/ Pictures]
Mr. Shailer Cummings of the Ocean Chemistry and EcosystemsDivision participated in the R/V Gordon Gunter Cruise, May 27 – June 4, 2010. [Mission Report]
Mr. Shailer Cummings of the Ocean Chemistry and Ecosystems Division participated in the R/V Nancy Foster Loop Current Cruise, June 30 – July 18, 2010. [Mission Report]
Dr. Michelle Wood, Director of AOML’s Ocean Chemistry and Ecosystems Division was responsible for interpreting and managing a range of water column measurements during a leg of the R/V Seward Johnson Florida Shelf-Edge Expedition (FLoSEE) Cruise, July 9 – August 9, 2010. [Website]
Mr. George Berberian of the Ocean Chemistry and Ecosystems Division provided high-quality dissolved oxygen analyses during the R/V Ocean Veritas Deepwater Horizon Cruise #12, August 1 – August 2, 2010. [Report]
Mr. George Berberian of the Ocean Chemistry and Ecosystems Division provided high-quality dissolved oxygen analyses during the R/V Brooks McCall Deepwater Horizon Cruise #16 (Legs 1 & 2), August 4 – August 11, 2010. [Report]
Mr. Michael Shoemaker of the Ocean Chemistry and Ecosystems Division acted as trustee on the Natural Resource Damage Assessment (NRDA) Sediment Study Cruise aboard the R/V Gyre, September 14 – September 29, 2010.
Joint Analysis Group (JAG)
Dr. Richard Wanninkhof, an AOML scientist in the Ocean Chemistry & Ecosytems Division, was an active member of the Joint Analysis Group (JAG) for Surface and Sub-Surface Oceanography, Oil and Dispersant Data since its founding shortly after the spill began. The JAG was a collaborative effort between the National Oceanic and Atmospheric Administration (NOAA), the U.S. Environmental Protection Agency (EPA) and the White House Office of Science and Technology Policy (OSTP). JAG was developed to ensure a comprehensive and coordinated analysis of the oceanographic data collected in the Gulf of America by private, federal, and academic scientists. Click the button below to view the final report from the group.

Survey area and month of station occupation for monitoring for subsurface dispersed oil.
Objectives of this workshop
a. Review the needs of the operational community and decision makers
b. Communicate current efforts to monitor the oil spill
c. Identify the short term and long term (operational and scientific) monitoring goals
d. Define how to best accomplish these monitoring goals
Driving Innovative Science with Data
Access to data from several hydrographic cruises and flights carried out by NOAA and other institutions to monitor physical and chemical properties in the water column after the Deepwater Horizon oil spill event in 2010.
Publications & Reports
Publications
Ryan, J.P., Y. Zhang, H. Thomas, E.V. Reinecker, R.K. Nelson, and S.R. Cummings. A High-resolution Survey of a Deep Hydrocarbon Plume in the Gulf of America during the 2010 Macondo Blowout. Monitoring and Modelling the Deepwater Horizon Oil Spill, pp. 63-67, 2011. Ed. by Y. Liu, A. MacFadyen, J-G. Ji and R.H. Weisburg. American Geophysical Union.Shay, L.K., B. Jaimes, J.K. Brewster, P. Meyers, E. Claire Caskill, E. Uhlhorn, F. Marks, G.R. Halliwell, O.M. Smedstad, and P. Hogan. Airborn Ocean Surveys of the Loop Current Complex from NOAA WP-3D in Support of the Deepwater Horizon Oil Spill. Monitoring and Modelling the Deepwater Horizon Oil Spill, pp. 131-152, 2011. Ed. by Y. Liu, A. MacFadyen, J-G. Ji and R.H. Weisburg. American Geophysical Union. [PDF]
Atwood, D. K., F. J. Burton, J. E. Corredor, G. R. Harvey, A. J. Mata-Jimenez, A. Vasquez-Botello, and B. A. Wade. Results of the CARIPOL Petroleum Pollution Monitoring Project in the Wider Caribbean. Marine Pollution Bulletin, Vol. 18 (10), 540-548, 1987.
Atwood, D. K., H. H. Cummings, W. J. Nodal, and R. Culbertson. The CARIPOL Petroleum Monitoring Project and the CARIPOL Petroleum Pollution Database. Caribbean Journal of Science, Vol. 23 (1), 1-3, 1987.
Atwood, D. K. and S. Dinkel-McKay. Floating Tar and Disssolved Dispersed Petroleum Hydrocarbons in the Northern Gulf of America and the Straits of Florida. Caribbean Journal of Science, Vol. 23 (1), 73-76, 1987.
Atwood, D. K. and R. L. Ferguson. An Example Study of the Weathering of Spilled Petroleum in a Tropical Marine Environment: Ixtoc-1. Bulletin of Marine Science, 32(1): 1-13, 1982.
Romero, G. C., G. R. Harvey and D. K. Atwood. Stranded Tar on Florida Beaches: September 1979 – October 1980. Marine Pollution Bulletin, Vol. 12 (8), 280-284, 1981.
Androulidakis, Y., Kourafalou, V., Le Hénaff, M., Kang, H.-S., and Ntaganou, N., 2021: The role of mesoscale dynamics over northwestern Cuba in the Loop Current evolution in 2010, during the Deepwater Horizon incident. Journal of Marine Science and Engineering, 9(2):188 (https://doi.org/10.3390/jmse9020188).
Hole, L.R., Dagestad, K.-F., Rohrs, J., Wettre, C., Kourafalou, V.H., Androulidakis, Y., Kang, H., Le Hénaff, M., and Garcia-Pineada, O., 2019: The DeepWater horizon oil slick: High resolution model simulations of river front effects, initialized and verified by satellite observations. Journal of Marine Science and Engineering, 7(10):329 (doi:10.3390/jmse7100329).
Goni, G., J. Trinanes, A. MacFadyen, D. Streett, M.J. Olascoaga, M.L. Imhoff, F. Muller-Karger, and M.A. Roffer, 2015: Variability of the Deepwater Horizon surface oil spill extent and its relationship to varying ocean currents and extreme weather conditions. In Mathematical Modelling and Numerical Simulation of Oil Pollution Problems , M. Ehrhardt (ed.), Springer-Verlag, New York, 1-22, (doi:10.1007/978-3-319-16459-5_1) [PDF]
Smith, R.H., E.M. Johns, G.J. Goni, J. Trinanes, R. Lumpkin, A.M. Wood, C.R. Kelble, S.R. Cummings, J.T. Lamkin and S. Privoznik, 2014: Oceanographic conditions in the Gulf of America in July 2010, during the Deepwater Horizon oil spill. Cont. Shelf Res., 77, 118-131. [PDF]
Smith, R ., E. Johns , G. J. Goni , J. Trinanes , R. Lumpkin , A. M. Wood, C. R. Kelble, S. R. Cummings, J. T. Lamkin and S. Privoznik, 2013: Oceanographic conditions in the Gulf of America in July 2010, during the Deepwater Horizon oil spill. Cont. Shelf Res., 77, 118-131. [PDF]
Srinivasan A., M. LeHenaff, V.H. Kourafalou, W.C. Thacker, N.F. Tsinoremas, J. helgers, C.B. Paris, H. Kang, M. Iskandarani, J.P. zysman and O.M. Knio, 2011: Many Task Computing for Modeling the Fate of Oil Discharged from the Deep Water Horizon Well Blowout. IEEE Xplore, doi:10.1109/MTAGS.2010.5699424, pages 1-7. [PDF]
Harvey, G. R., A. G. Requejo, P. A. McGillivary, and J. M. Tokar. Observation of a Subsurface Oil-Rich Layer in the Open Ocean. Science, Vol. 205 (4410), 999-1001, 1979.
Reports