Simulated Flow Trajectories

Why are they helpful?

Numerical simulations of flow trajectories show how the ocean currents spread idealized particles released from a given location. These simulations are based on satellite observations or numerical simulations of ocean surface currents. The spreading of these idealized particles approximates that of oil, below the ocean surface, where the effect of wind and sunlight are not that important compared with the surface where discrepancies between these simulations and the spreading of oil are possible.

Lagrangian Coherent Structures

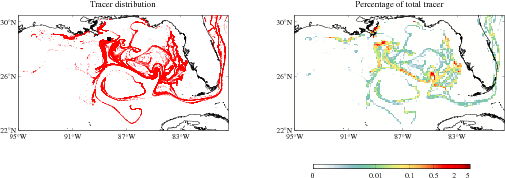
The map below shows an animation of the evolution of surface water particles (in black) released daily since April 20 at the Deepwater Horizon location, overlaid on the finite-time Lyapunov exponent field (FTLE) for the corresponding date. Convoluted bands of most intense red tones indicate attracting Lagrangian Coherent Structures (LCS), which act as barriers for the moving particles. Consistent with this, please note that in these animations, the distribution of the simulated particles closely follow the deformation of the LCS over time, by having their trajectories along high values (in red) of FTLEs. The velocity field used for these simulations are daily outputs of the IASNFS NCOM model (Navy Coastal Ocean Model). These maps are only available for the period of the oil spill.

Surface particles evolution in the GOM

For surface particle evolutions at different dates and depths:

The maps below show simulated surface particle distribution (right) and percentage (in log scale) of total simulated particles (left) on June 28, 2010, for particles released at the Deepwater Horizon location every day since April 20, 2010.

Surface particles simulations in the GOM

For similar simulations on different dates and depths:

Surface currents data source: Experimental Real-Time Intra-Americas Sea Nowcast/Forecast System (IASNFS).

LCS figures and animations courtesy of Dr. M. J. Olascoaga. For more details, please visit the Lagrangian Coherent Structures web page at UM/RSMAS.

Synthetic Drifter Simulations

The map below shows simulated trajectories of 50 synthetic drifters released daily in the location of the Deepwater Horizon since April 20, 2010. The pathways of the synthetic drifters are shown in blue. The yellow shading and arrows show the scalar and vector currents, respectively, at the ocean surface. Ocean currents used for these simulations are daily outputs of the IASNFS NCOM model (Navy Coastal Ocean Model). These maps are only available for the period of the oil spill.

Simulated synthetic drifter trajectories

For synthetic drifter distributions on previous dates:

To see an animation of synthetic drifters, please select one of the month below:

April-May 2010 August 2010
June 2010
July 2010

The map below shows simulated trajectories of 50 synthetic drifters released daily in the location of the Deepwater Horizon since April 20, 2010 at 1200 m of depth. The pathways of the synthetic drifters are shown in blue. The yellow shading and arrows show the scalar and vector currents, respectively, at this depth. Ocean currents used for these simulations are daily outputs of the IASNFS NCOM model (Navy Coastal Ocean Model). These maps are only available for the period of the oil spill.

Simulated synthetic drifter trajectories at 1200 m

For synthetic drifter distributions on previous dates:

To see an animation of synthetic drifters, please select one of the month below:

April-May 2010 August 2010
June 2010
July 2010

Ocean currents data source: Experimental Real-Time Intra-Americas Sea Nowcast/Forecast System (IASNFS).

Statistical Drifter Density Simulations

The map below is an animation of 10,000 simulated drifters released at the site of the Deepwater Horizon oil spill. Shading is the density (number) of drifters. Their subsequent motion is dictated by the statistical behavior of all the real drifters that have ever passed across the same area. Note that this simulation is using statistics from drifters drogued at 15 m depth, and thus does not simulate oil on the ocean surface exposed to direct wind forcing. In addition, the statistics are calculated using all historical drifter observations and thus reflect the climatological position of the Loop Current and other major current systems, rather than their present configuration (see this link for present conditions).

Density of simulated drifters

Data source: Drifter Data Assembly Center (DAC)

Arrival Time Simulations

Earliest arrival time of simulated drifters released at the site of the Deepwater Horizon oil spill. Note that this simulation uses statistics from drifters drogued at 15 m depth, and thus does not simulate oil on the ocean surface exposed to direct wind forcing. In addition, the statistics are calculated using all drifter observations and thus reflect the climatological position of the Loop Current and other major current systems, rather than their current configuration.

Earliest arrival time of simulated drifters

Data source: Drifter Data Assembly Center (DAC)