Airborne EXpendable BathyThermograph (AXBT) Observations

The Airborne EXpendable BathyThermograph (AXBT) measures ocean temperature as a function of depth. The temperature profiles nominally produced are from the surface to 350 m, at 1.5 m vertical intervals. During several joint missions by the University of Miami and NOAA in the Gulf of Mexico, these probes were deployed from a NOAA WP-3D aircraft .

The location of AXBT deployments (circles) for each mission are shown in the maps below. The maps also show the corresponding sea surface temperature (SST, °C) superimposed on the regional bathymetry (in meters). The location of the Deepwater Horizon is denoted by a star. Dates of each mission and the corresponding temperature sections can be viewed below. Also, comparisons between observed temperature sections and profiles with outputs from the Intra-Americas Sea Ocean Nowcast/Forecast System (IASNFS) dataset are available.

The AXBT data used in this site can be accessed via ftp.

Why are these observations helpful?

These products provide information about the large scale circulation in the Gulf of Mexico. They describe the surface temperature as well as the structure of oceanic thermal features at different depths. They also provide information about ocean heat content and can be used in the validation of numerical models currently being utilized in the Gulf of Mexico monitoring.

Temperature Sections for July 9, 2010

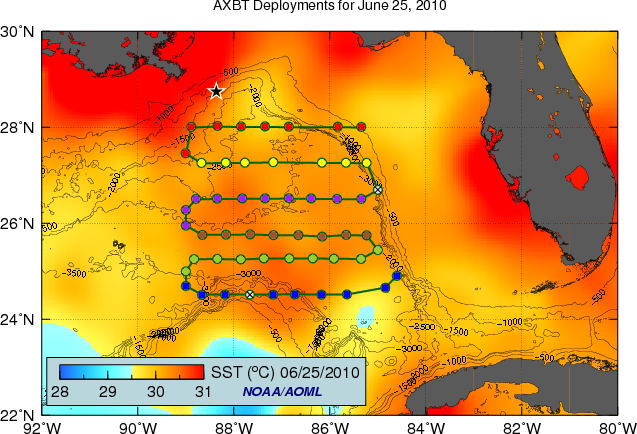
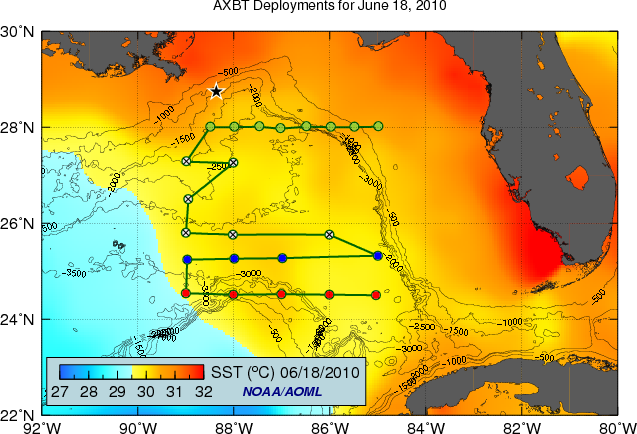
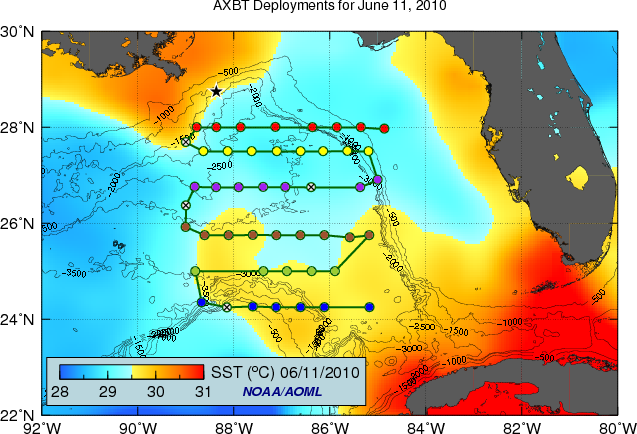
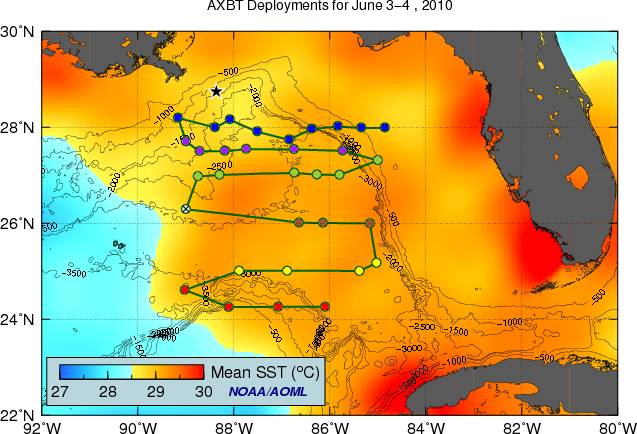
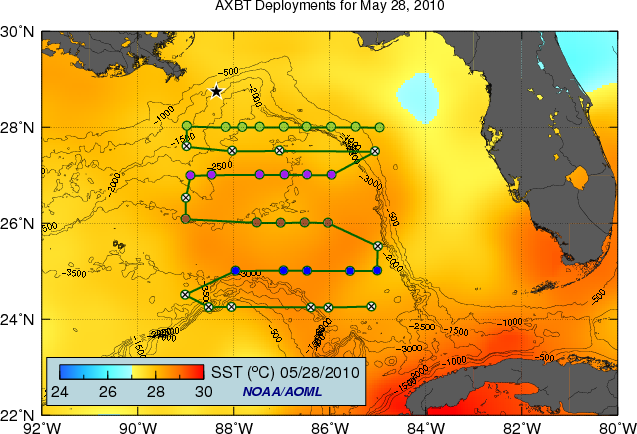
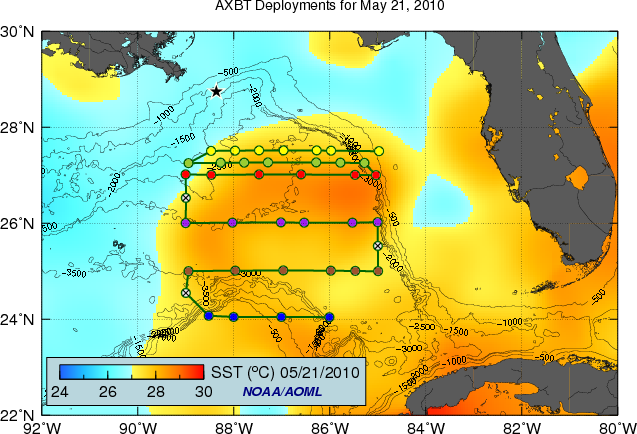
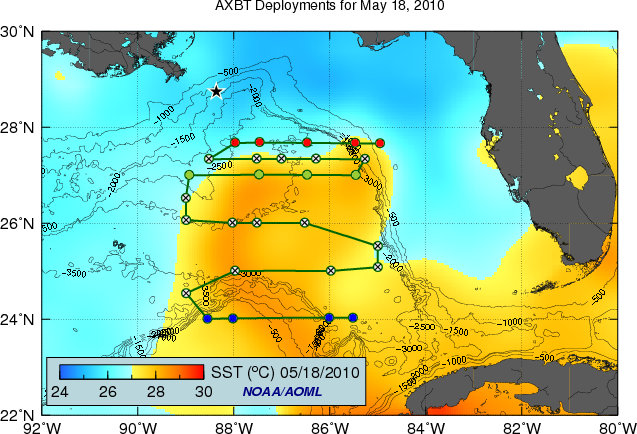
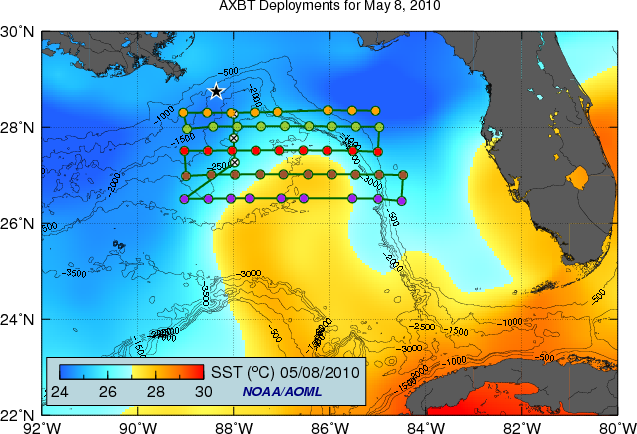
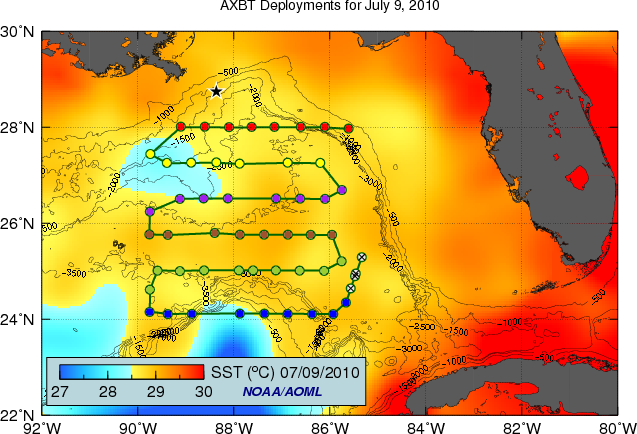
To view temperature sections for July 9, 2010 at 24°N (blue circles), 25°N (green circles), 25.75°N (brown circles), 26.5°N (purple circles), 27.2°N (yellow circles), and 28°N (red circles), please click on the flight transects in the map below. Deployments denoted by white circles with crosshairs were omitted from the temperature sections.

AXBT Deployments for July 9, 2010

To view temperature maps at different depths, please click on one of the depths below:

0m 100m 200m 300m

To view a comparison between observed temperature sections and temperature profiles with corresponding IASNFS model results, please click on the links below:

24°N (blue circles)

sections profiles

25°N (green circles)

sections profiles

25.75°N (brown circles)

sections profiles

26.5°N (purple circles)

sections profiles

27.2°N (yellow circles)

sections profiles

28°N (red circles)

sections profiles

Temperature Sections for June 25, 2010

To view temperature sections for June 25, 2010 at 24.5°N (blue circles), 25.25°N (green circles), 25.75°N (brown circles), 26.5°N (purple circles), 27.2°N (yellow circles), and 28°N (red circles), please click on the flight transects in the map below. Deployments denoted by white circles with crosshairs were omitted from the temperature sections.

AXBT Deployments for June 25, 2010

To view temperature maps at different depths, please click on one of the depths below:

0m 100m 200m 300m

To view a comparison between observed temperature sections and temperature profiles with corresponding IASNFS model results, please click on the links below:

24.5°N (blue circles)

sections profiles

25.25°N (green circles)

sections profiles

25.75°N (brown circles)

sections profiles

26.5°N (purple circles)

sections profiles

27.2°N (yellow circles)

sections profiles

28°N (red circles)

sections profiles

Temperature Sections for June 18, 2010

To view temperature sections for June 18, 2010 at 24.5°N (red circles), 25.3°N (blue circles), and 28°N (green circles), please click on the flight transects in the map below. Deployments denoted by white circles with crosshairs were omitted from the temperature sections.

AXBT Deployments for June 18, 2010

To view temperature maps at different depths, please click on one of the depths below:

0m 100m 200m 300m

To view a comparison between observed temperature sections and temperature profiles with corresponding IASNFS model results, please click on the links below:

24.5°N (red circles)

sections profiles

25.3°N (blue circles)

sections profiles

28°N (green circles)

sections profiles

Temperature Sections for June 11, 2010

To view temperature sections for June 11, 2010 at 24.25°N (blue circles), 25°N (green circles), 25.75°N (brown circles), 26.75°N (purple circles), 27.5°N (yellow circles), and 28°N (red circles), please click on the flight transects in the map below. Deployments denoted by white circles with crosshairs were omitted from the temperature sections.

AXBT Deployments for June 11, 2010

To view temperature maps at different depths, please click on one of the depths below:

0m 100m 200m 300m

To view a comparison between observed temperature sections and temperature profiles with corresponding IASNFS model results, please click on the links below:

24.25°N (blue circles)

sections profiles

25°N (green circles)

sections profiles

25.75°N (brown circles)

sections profiles

26.75°N (purple circles)

sections profiles

27.5°N (yellow circles)

sections profiles

28°N (red circles)

sections profiles

Temperature Sections for June 3-4, 2010

To view temperature sections for June 3, 2010 at 24.25°N (red circles), 25°N (yellow circles), 26°N (brown circles), 27°N (green circles), 27.5°N (purple circles), and June 4, 2010 at 28°N (blue circles), please click on the flight transects in the map below. Deployments denoted by white circles with crosshairs were omitted from the temperature sections.

AXBT Deployments for June 3-4, 2010

To view temperature maps at different depths, please click on one of the depths below:

0m 100m 200m 300m

To view a comparison between observed temperature sections and temperature profiles with corresponding IASNFS model results, please click on the links below:

24.25°N (red circles)

sections profiles

25°N (yellow circles)

sections profiles

26°N (brown circles)

sections profiles

27°N (green circles)

sections profiles

27.5°N (purple circles)

sections profiles

28°N (blue circles)

sections profiles

Temperature Sections for May 28, 2010

To view temperature sections for May 28, 2010 at 25°N (blue circles), 26°N (brown circles), 27°N (purple circles), 28°N (green circles), please click on the flight transects in the map below. Deployments denoted by white circles with crosshairs were omitted from the temperature sections.

AXBT Deployments for May 28, 2010

To view temperature maps at different depths, please click on one of the depths below:

0m 100m 200m 300m

To view a comparison between observed temperature sections and temperature profiles with corresponding IASNFS model results, please click on the links below:

25°N (blue circles)

sections profiles

26°N (brown circles)

sections profiles

27°N (purple circles)

sections profiles

28°N (green circles)

sections profiles

Temperature Sections for May 21, 2010

To view temperature sections for May 21, 2010 at 24°N (blue circles), 25°N (brown circles), 26°N (purple circles), 27°N (red circles), 27.2°N (green circles), 27.5°N (yellow circles), please click on the flight transects in the map below. Deployments denoted by white circles with crosshairs were omitted from the temperature sections.

AXBT Deployments for May 21, 2010

To view temperature maps at different depths, please click on one of the depths below:

0m 100m 200m 300m

To view a comparison between observed temperature sections and temperature profiles with corresponding IASNFS model results, please click on the links below:

24°N (blue circles)

sections profiles

25°N (brown circles)

sections profiles

26°N (purple circles)

sections profiles

27°N (red circles)

sections profiles

27.2°N (green circles)

sections profiles

27.5°N (yellow circles)

sections profiles

Temperature Sections for May 18, 2010

To view temperature sections for May 18, 2010 at 24°N (blue circles), 27°N (green circles), 27.7°N (red circles), please click on the flight transects in the map below. Deployments denoted by white circles with crosshairs were omitted from the temperature sections.

AXBT Deployments for May 18, 2010

To view temperature maps at different depths, please click on one of the depths below:

0m 100m 200m 300m

Temperature Sections for May 8, 2010

To view temperature sections for May 8, 2010 at 26.5°N (purple circles), 27°N (brown circles), 27.5°N (red circles), 28°N (green circles), 28.2°N (gold circles), please click on the flight transects in the map below. Deployments denoted by white circles with crosshairs were omitted from the temperature sections.

AXBT Deployments for May 8, 2010

To view temperature maps at different depths, please click on one of the depths below:

0m 100m 200m 300m

Data source for SST: Remote Sensing Systems (RSS)

IASNFS model data source: Northern Gulf Institute (NGI)