Air-Sea CO2 Flux Maps
SCROLL TO LEARN MORE
Creating Flux Maps – Approach
The major goal of NOAA’s Global Carbon Cycle Program (GCCP) is to quantify sources and sinks of carbon dioxide. One means of doing this is to determine the CO2 flux across the air-sea interface. The air-sea CO2 flux is defined as the products of the CO2 partial pressure difference across the air-sea interface and a quantity referred to as the gas transfer velocity that is often related to wind speed. Thus the air-sea CO 2 flux is defined as:
FCO2 = k ∆pCO2
Where ∆pCO2 is the partial pressure gradient between surface ocean and air.
The ∆pCO2 is measured as part of our program on research ships and volunteer observing ships (VOS). The challenge is to translate these ∆pCO2 observations, along a cruise line at a particular time, to a flux map that covers a region.
Our approach is to relate surface water partial pressure of CO2, pCO2sw to factors that control it and that are measured at greater frequency than our pCO2sw measurements. We then create algorithms between pCO2sw and these parameters. Fields of the parameters are created and from the algorithms we then create the regional pCO2sw fields. These fields are then combined with the gas transfer velocities to create the flux fields. The gas transfer velocities are determined from relationships of gas transfer with wind and the regional winds are determined from satellite observations.
The first choice of parameters to extrapolate the pCO2sw observations are those that can be observed from space in a synoptic fashion through remote sensing such as sea surface temperature and color. Other parameters that can be obtained at high resolution include those that are measured from VOS and floats. A schematic of the steps involved are shown in the figure below.
The work is funded through a grant “Ocean Carbon Watch: Improving Air-Sea CO2 Flux Estimates Through Remote Sensing” to Rik Wanninkhof, AOML; Richard Feely, PMEL; and Kent Hughes, NESDIS (National Environmental Satellite Data, and Information Service of NOAA) with as collaborators Joaquin Trinanes of CIMAS and Are Olsen of the University of Bergen. The initial objective is to use the data from the VOS line to create flux algorithms in the North Atlantic and North Pacific. We plan to work with international colleagues to accomplish this task.
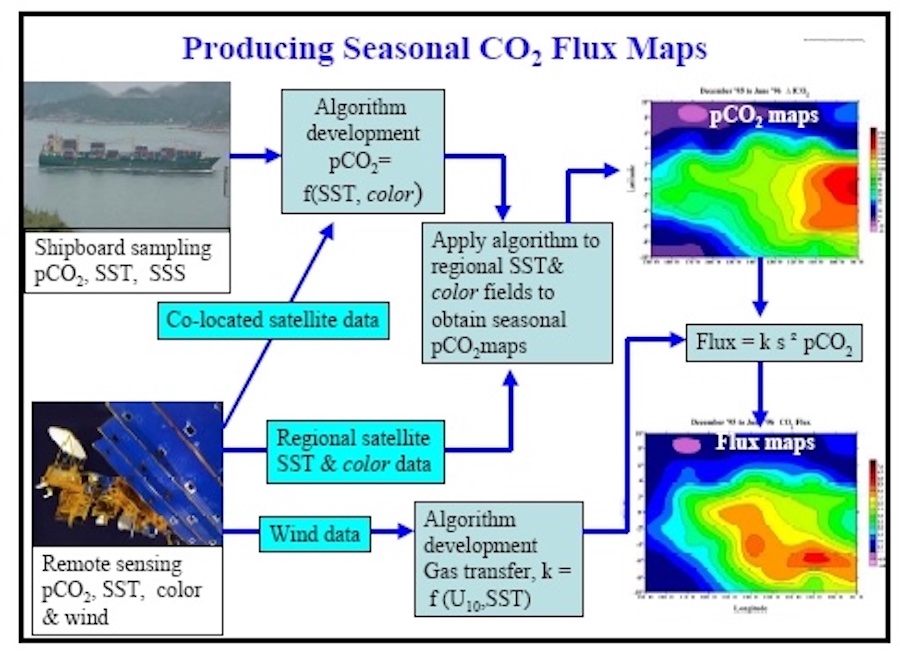
Schematic of steps involved to create flux maps. From ship data and co-located satellite data we create algorithms. These algorithms are applied to regional fields of remotely sensed parameters such as sea surface temperatire (SSI) and color. Using relationships of wind speed and gas exchange the gas transfer velocities are determined. The gas transfer velocities and A pCO2 fields are then used to determine regional fluxes.
Explorer of the Seas – Proof of Concept
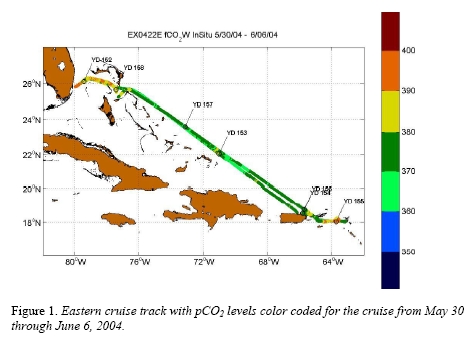
The Explorer of the Seas project is an excellent venue to study the feasibility of creating flux maps using remote sensing because of the high density of in situ measurements and high quality remotely sensed data in the region. The cruise track are repeated on a bi-weekly basis alternating from an eastern track from Miami to St. Maartin (Figure 1) and a western track between Miami and Mexico (Figure 2). The weekly data is posted at: http://www.aoml.noaa.gov/ocd/gcc/explorer_introduction.php.

Details of production of the flux maps for 2002 can be found in Olsen et al. 2004, [Olsen, A., J. Triñanes, and R. Wanninkhof, Sea-air flux of CO2 in the Caribbean Sea estimated using in situ and remote sensing data, Remote Sensing of Environment , 89 , 309-325, 2004]. Olsen and co-workers determined that surface water pCO2sw in this region could be well predicted from a relationship with SST and location of the form:
n = 40204; rms = 5.7 uatm; Corr = 0.87
Triñanes fit the 2003 and 2004 data with a similar relationship:
For 2003: pCO2sw = 10.451 * SST + 0.3629 * lat – 0.5144 * lon + 36.5203
n= 60373; rms = 5.9 ; Corr = 0.92
where n is the number of pCO2sw data points used for the fit, rms is the root mean square deviation, and Corr is the correlation coefficient. The two relationships are very similar except that the latter gives pCO2sw values about 4 uatm higher than the former. Over half this change can be attributed to the rise in surface ocean pCO2 levels following the atmospheric increase.
For 2004: pCO2sw = 10.64 * SST + 0.9745 * lat – 0.3687 * lon + 30.68
n = 86695; rms = 7 uatm; Corr = 0.85
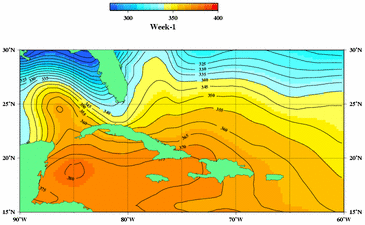
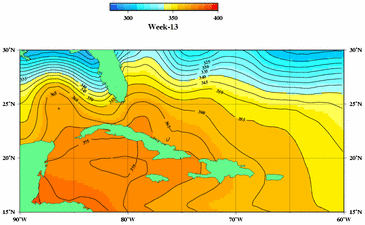
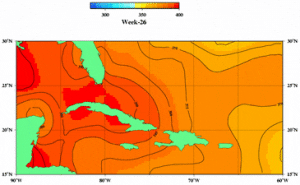
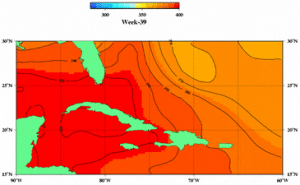
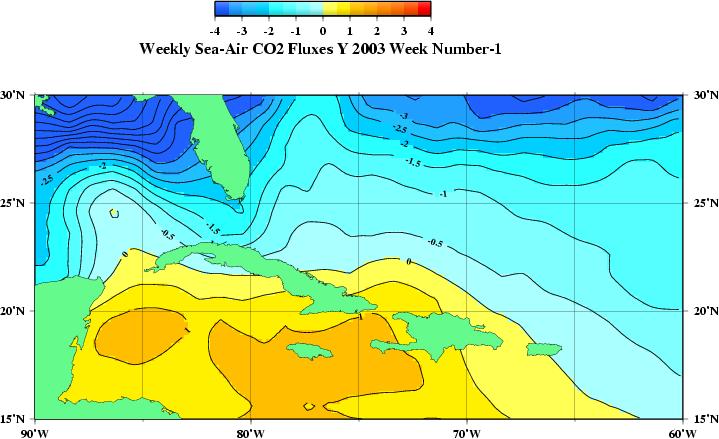
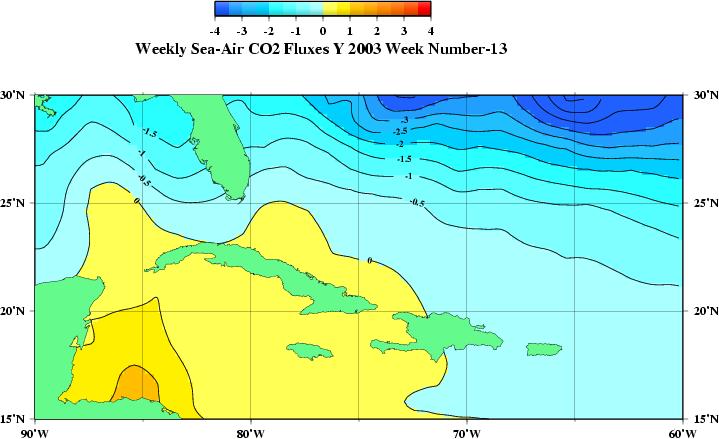
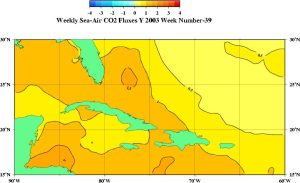
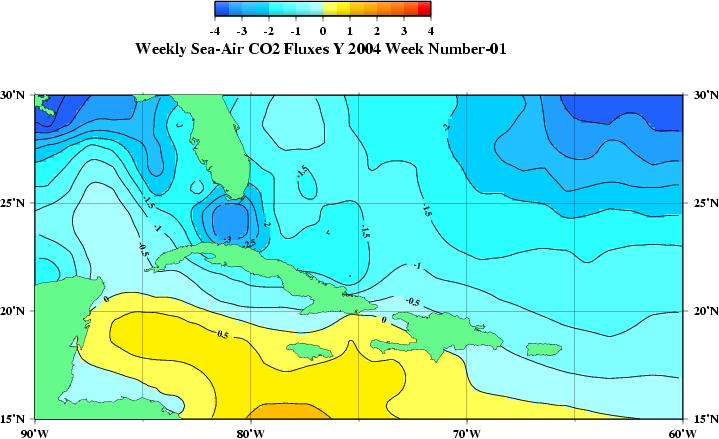
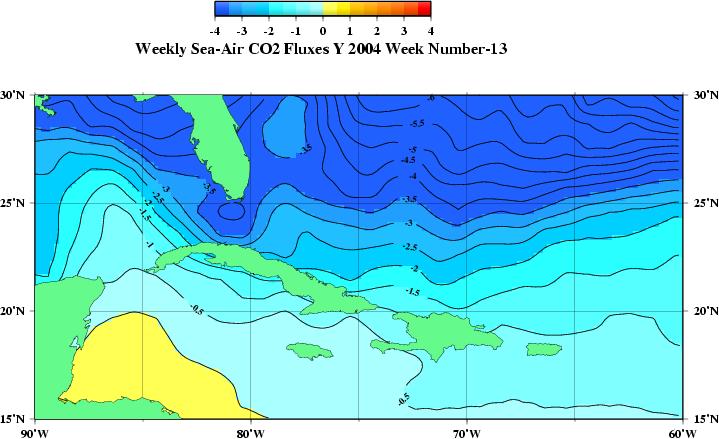
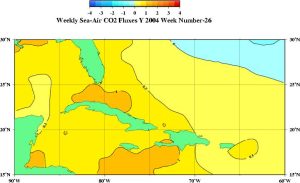
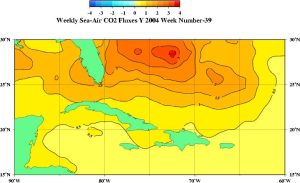
These relationships are used to create weekly flux maps for the region from 15° to 30° N and 60° to 90° W (long is negative).
Caribbean Sea fCO2w Maps – 2003
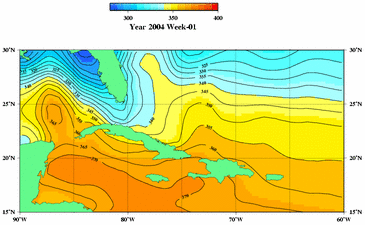
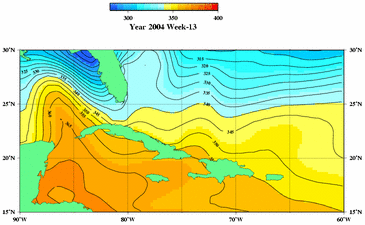
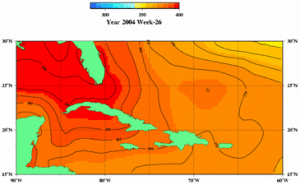
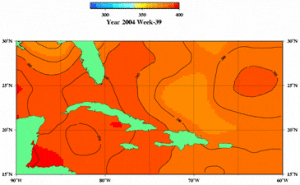
Caribbean Sea fCO2w Maps – 2004
Caribbean Sea CO2 Flux Maps – 2003
Caribbean Sea CO2 Flux Maps – 2004
