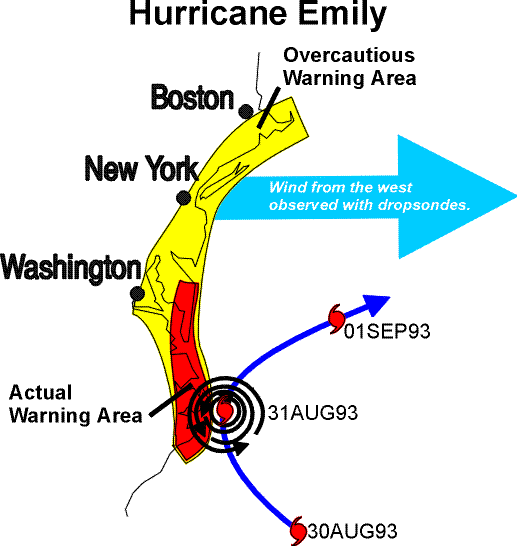
Storm MotionWhen a hurricane is on the weather map, everyone wants to know where it will go. Only the people whom the storm will hit have an overwhelming concern with its winds, rainfall or storm surge. Everyone else wants ressuurance that it will miss. Forecasts are always uncertain. For individuals and enterprises there is invariably a tradeoff between the cost and effort of preparations and the probability of casualties. Hurricane conditions typically affect a swath of about 100 nautical miles wide; the error in a 24-hour forecast also is now somewhat less than 100 nautical miles. Thus, a prudent forecaster expects to raise warnings on 300 nautical miles of coastline: 100 nautical miles that actually feel the hurricane and 100 nautical miles on either side to allow for forecast error.Warnings are expensive. The economic cost of raising a warning, in terms of lost productivity, safeguarding homes and industries, evacuation of aircraft and vessels, and canceled beachfront vacations averages $0.5 to 1.0 M per mile. The cost depends upon the amount of coastal development. If a major city, such as Miami or New Orleans, lies in the warning area, cost escalates dramatically. Sometimes, as happened in Hurricane Emily of 1993, models and observations combine to give forecasters particularly clear insight into the meteorological situation, so that they can exclude large sections of coastline, perhaps hundreds of miles long, from the warning area and save the economy as much as $100M. When, on the other hand, as happened in Hurricane Floyd of 1999, the storm track remains offshore running parallel with the coast, warnings extend far beyond the area affected, and overwarning costs are immense. As a problem in fluid mechanics, the dominant factor in hurricane motion is the surrounding wind. In effect, the storm is carried downstream by the average environmental wind. It also "propagates" westward and poleward because it is on a rotating, spherical Earth. Local vertical is more nearly parallel with the planet's axis of rotation in high latitudes. "Beta effect" propagation arises from the poleward increase of the planet's rotation around local vertical. Air that moves around the the vortex center with the storm circulation tends to keep a constant value of the sum of the planetary and relative vorticity. Vorticity in the context is the tendency of the air to swirl around a vertical axis. It is the stuff of vorticies. An anticyclonic asymmetry thus forms on the northeast side of
the vortex and a cyclonic asymmetry on the
southwest side.
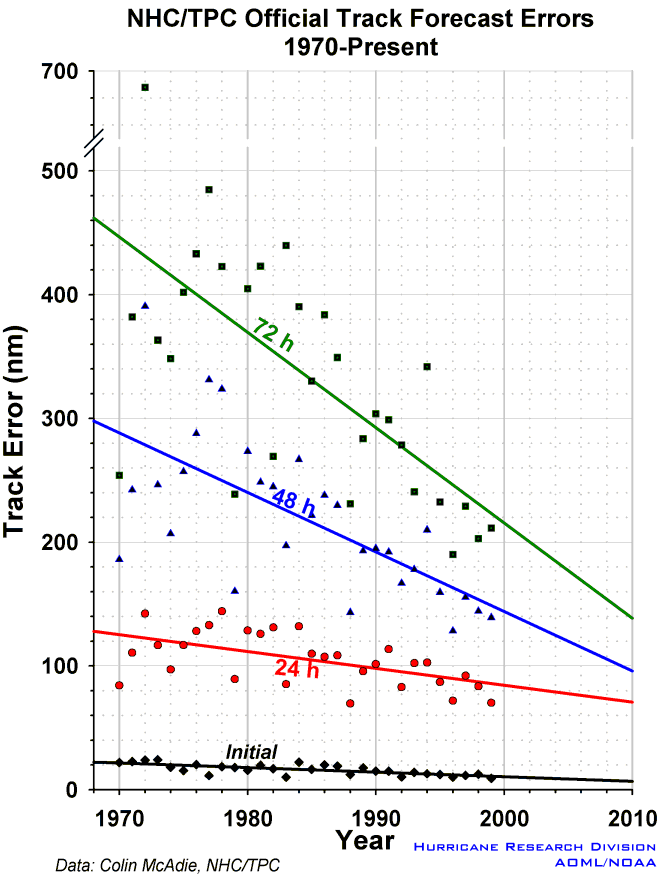
Over the last 30 years, the decrease in forecast
error has averaged about 1% per year
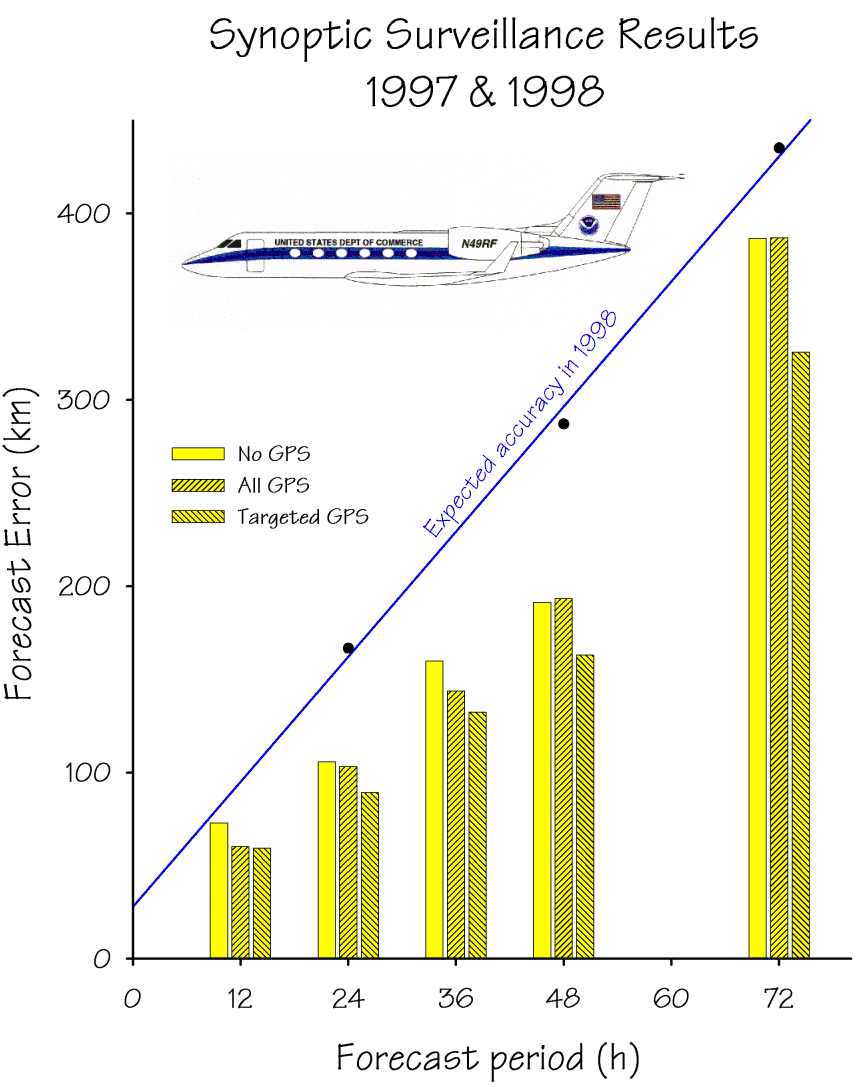
In these "synoptic surveillance" experiments, the atmospheric
state is measured by
More widespread and efficient observations of this kind are the primary reason that NOAA commissioned its new Gulfstream IV jet that has flown synoptic surveillance missions operationally since 1997. The jet procurement included the new GPS dropsonde instruments themselves and new faster in-flight processing and data-visualization software. These improvements are important contributors to the accelerated decrease in forecast errors in the late 1990s. |
Links of Interest
AOML Tools & Resources
Employee Tools
Stay Connected
|

| ||