Hightlights of Missions into
Hurricane Barry 2019
- Five NOAA P-3 missions were flown into pre- and
developed Barry in the Gulf of Mexico. The missions were flown as taskings
for the NOAA/National Centers for Environmental Prediction/Environmental
Modeling Center (NCEP/EMC) to provide airborne data collection (tail
Doppler radar, dropsonde, Stepped Frequency Microwave Radiometer [SFMR],
and flight level observations), to initialize the operational Hurricane
Weather Research and Forecasting (HWRF) Model. The five missions were
flown every 12 hours, operating out of Lakeland, FL, with takeoffs at 4
AM (0800 UTC) and 4 PM EDT (2000 UTC) between 10 and 12 July. The five
missions were:
- 20190710H1 [4 PM EDT, Wednesday, July 10]
- 20190711H1 [4 AM EDT, Thursday, July 11]
- 20190711H2 [4 PM EDT, Thursday, July 11]
- 20190712H1 [4 AM EDT, Friday, July 12]
- 20190712H2 [4 PM EDT, Friday, July 12]
- Several HRD scientists participated as crew onboard the P-3 (NOAA42): Rob
Rogers, Frank Marks, Paul Reasor, Sim Aberson, Kathryn Sellwood, Steve
Diaz, Trey Alvey, and Jon Zawislak. In addition, AOML/HRD summer interns
and visitors flew aboard the P-3, including Addison Alford (visiting from
Univ. of Oklahoma), Kelly Nunez Ocasio (NERTO from Penn State University),
and Nicholas Johnson (Hollings, Univ. of Alabama at Huntsville).
- John Gamache, Nancy Griffin, and Joe Griffin provided ground radar
science support for the P-3. The ground support assist in the transmission
of the Tail Doppler Radar (TDR) analyses from the aircraft to EMC and NHC
(for visualization in their AWIPS-II environment).
- A total of 101 dropwindsondes were launched over the five P-3 missions
into Barry (24 in 20190710H1, 18 in 20190711H1, 20 in 20190711H2, 24 in 20190712H1,
and 15 in 20190712H2). Many of the sondes were launched from altitudes above
20 kft, which were critical to providing mid-tropospheric measurements of
humidity of Barry. Flight above altitudes of 10-12 kft are atypical of the
P-3 EMC missions, therefore datasets collected for this storm are
particularly unique and represent a potential new strategy for sampling
the early stages of storms (i.e., pre-storm, tropical depression, and
tropical storm).
- A total of 10 AXBTs (Airborne EXpendable BathyThermographs) were launched
from the P-3 into pre-Barry (5 in 20190710H1, 5 in 20190711H1). These were
targeted at a cold ocean eddy along the forecast track of Barry to
supplement Argo float data located in a warm eddy just to the west of its
formation location.
- Although the primary mission of the P-3 flights were to meet operational
tasking requirements for NCEP/EMC, scientifically the observations obtained
over the 3 days will also greatly benefit the science goals within
experiments in the Genesis and Early Stages of the HFP science plan.
Sampling of this storm is unique in the historical HFP database, as not
only did missions capture intensification of a tropical storm, but also
observed the formation of the storm and the pre-storm environment. Flights
captured the genesis of Barry, with measurements consistent with the
strategies outlined in the
Precipitation Mode (PMODE) and
Pouch Experiments. Observations in later missions will also directly
benefit the Analysis of
Intensification Processes Experiment (AIPEX) objectives to
understand intensification processes of storms in moderate shear.
- During the first mission (20190710H1), one
short north-south leg on the southwest portion of the lawnmower pattern
was coordinated as an ADM-Aeolus Satellite Validation Module, one of the
Satellite Validation
experiments of the HFP plan. Aeolus is the first spaceborne wind lidar
and the goal is to validate the wind profiles obtained from the satellite.
The flight leg was timed for the satellite overpass and located to the
east of the satellite track (two extra dropsondes were released; four
total), which is intended to be offset given Aeolus' characteristics.
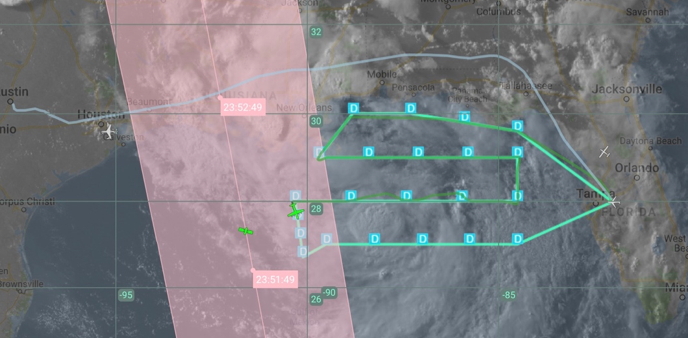
Fig. 1 ADM-Aeolus satellite validation module flown during
20190710H1, showing Aeolus (satellite symbol)
and the location of the P-3 (airplane symbol) flying the planned lawnmower
pattern. The "D"s on the flight track are dropsonde locations from the P-3.
|
- Convective burst modules
, part of the Early Stage in the HFP Plan, were flown on 3 of the missions
(20190711H1, 20190711H2, and 20190712H1). The goal was to observe the evolution
of the targeted convective region through repeated flight legs.

Fig. 2 Flown pattern for 20190710H1
|
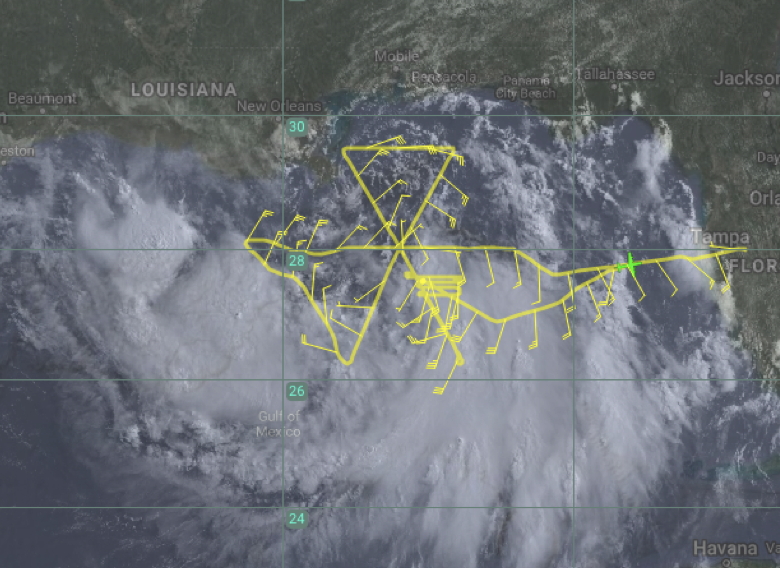
Fig. 3 Flown pattern for 20190711H1
|
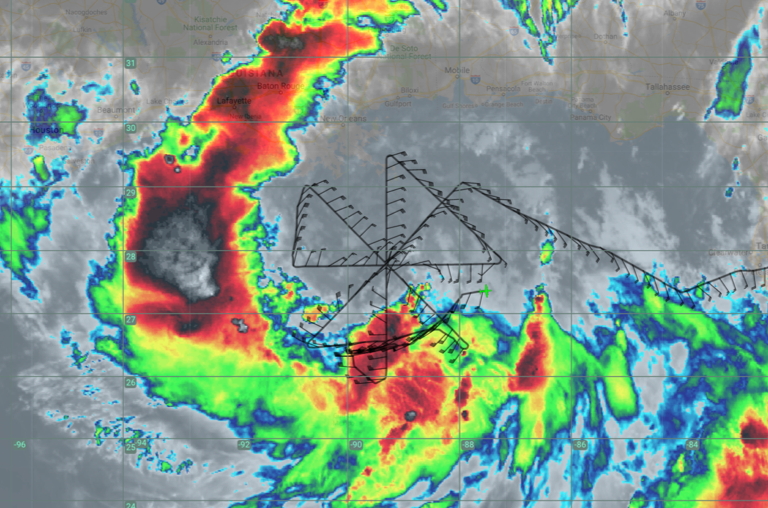
Fig. 4 Flown pattern for 20190711H2
|

Fig. 5 Flown pattern for 20190712H1
|
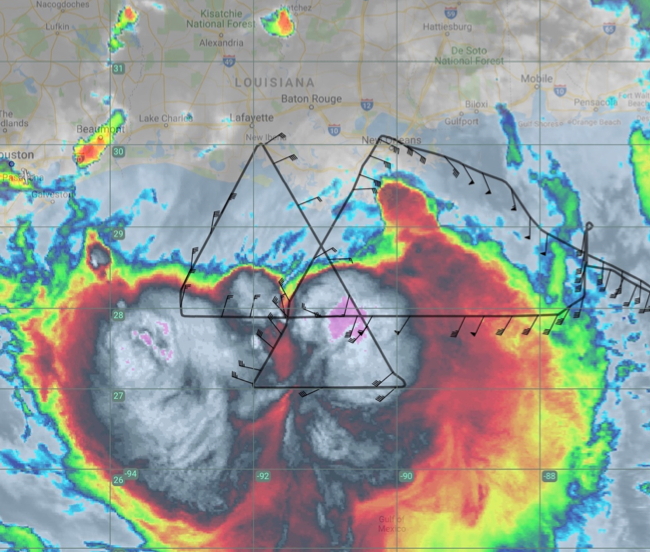
Fig. 6 Flown pattern for 20190712H2
|
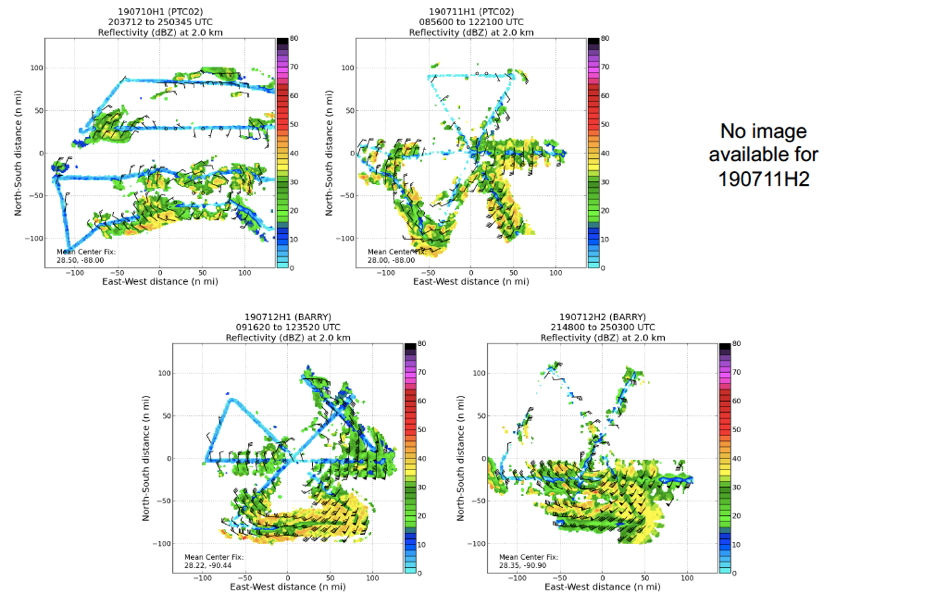
Fig. 7 Sequence of P-3 TDR analyses showing composite reflectivity
at 2 km, for: 20190710H1, 20190711H1, 20190711H2, 20190712H1, and 20190712H2
|
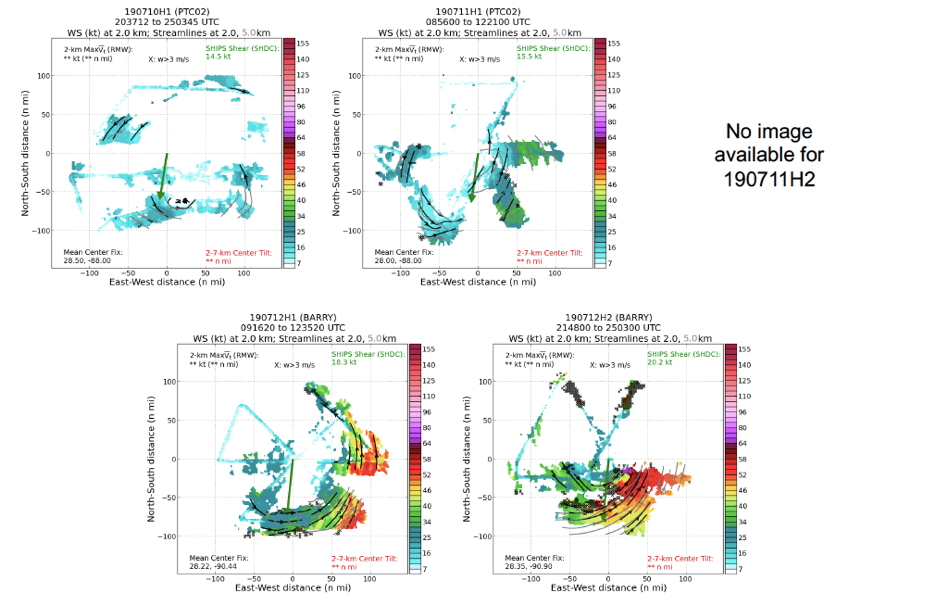
Fig. 8 Sequence of P-3 composite TDR analyses showing wind speed at 2
km (shading), as well as streamlines at 2.0 (black) and 5.0 km (grey) for:
20190710H1, 20190711H1, 20190711H2, 20190712H1, and 20190712H2
|
Last updated: August 05, 2019
|
|