
We modified the way NOAA’s new hurricane model forecasts what happens in the lowest part of the atmosphere based on observations from Hurricane Hunter research flights. The new scheme produced track forecasts that were up to 20% better than from the older scheme, a 15% improvement in detection of rapid intensification events, and smaller tropical cyclones that were closer to real ones. This modified scheme is being considered for implementation in the first operational version of NOAA’s new hurricane model, the Hurricane Analysis and Forecast System (HAFS), in 2023.
Summary: The lowest 1 to 2 km of the atmosphere, the planetary boundary layer (PBL), is the region where the energy from the warm ocean transfers to the atmosphere to fuel tropical cyclones, and where the wind and rain directly affect life and property. It can be difficult for numerical weather models to accurately simulate what happens in that region, and lots of approximations have to be made. In this study, we tested two different sets of equations that handle these approximations (PBL schemes) on a large set of forecasts from the Atlantic 2020 hurricane season. The older scheme has been used in models for several years, while the newer (known as MEDMF-TKE) has not been tested much in tropical cyclones. We made some tweaks to this scheme based on PBL observations collected during research flights into Hurricanes Allen and Hugo in the 1980s. To see how these changes would impact a large set of forecasts in terms of the forecasts of track, intensity, and structure, we compared forecasts from the model with the newly-modified scheme with the older scheme (which was used in previous versions of HAFS and other models like the Hurricane Weather Research and Forecasting (HWRF) model). This study highlights the importance of these approximations (and doing them accurately) for predicting intensity change, and also highlights the value of using data from NOAA Hurricane Hunter flights to improve hurricane models.
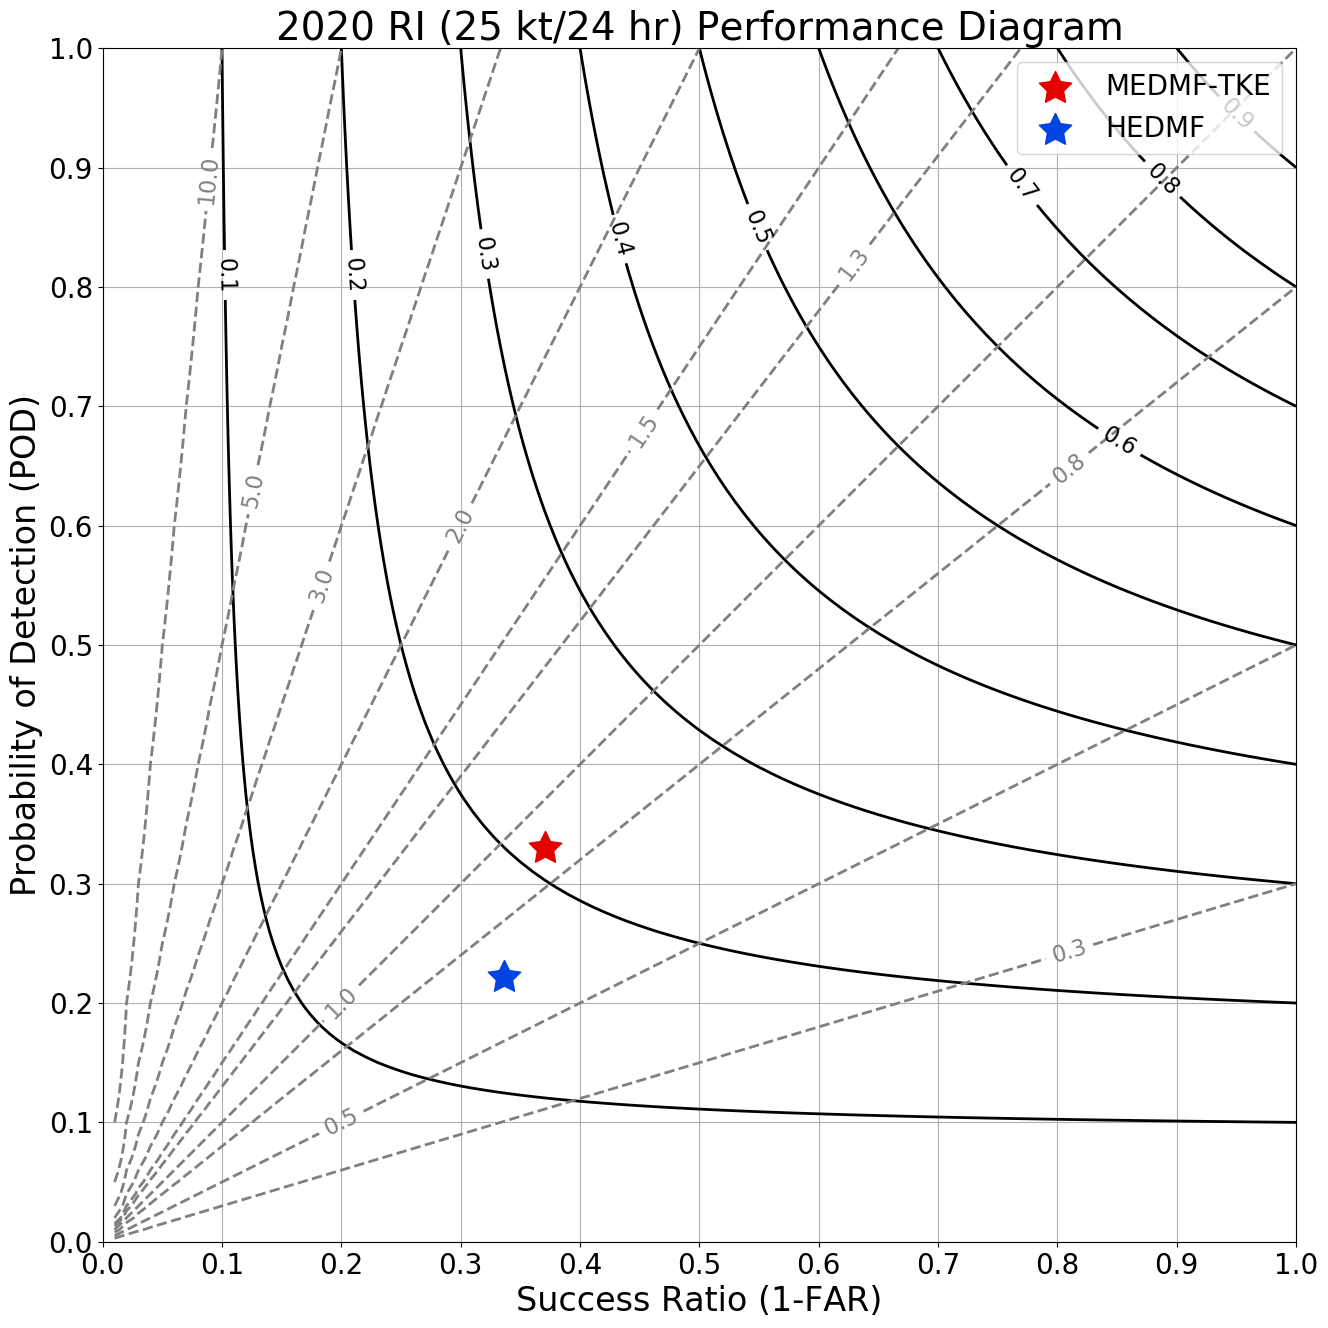
Figure 1: Performance diagram for rapid intensification skill (defined as an increase in wind speed of 25 kt in 24 h) for the two schemes. Perfect forecasts would be at the upper right of the diagram. The distance from the diagonal line represents the bias. The red star is closer to both the diagonal line and to the upper right, representing forecast improvement.
Conclusions and Findings:
The new scheme produces slightly up to 20% track forecasts than the original scheme. The intensity forecasts were also better, with a low intensity bias reduced by about 8 kt at day 3 of the forecast. Perhaps most importantly, the skill for forecasts of rapid intensification (24-hour increase in wind speed of 25 kt or more) was improved in the new scheme (Fig. 1).
The new MEDMF-TKE scheme had stronger inflow (air flowing into the storm at lower levels) and stronger eyewall thunderstorms, in line with what we see in observations of intensifying TCs. Both of these seemed to be a cause of the more rapid intensification.
We also examined some individual cases from the 2020 Atlantic hurricane season, including Hurricane Delta (from October 2020), to highlight an event where the newly-modified scheme showed a much better forecast of intensification (Figure 2). This paper highlights the importance of these lower-level approximations (and doing them accurately) for predicting hurricane intensity change, and also highlights the value of using Hurricane Field Program (HFP) data to improve hurricane models.
 Figure 2: Track (left) and intensity (right) forecasts for Hurricane Delta on 7 October 2020 at 1200 UTC from HAFS with the modified scheme and with the original PBL scheme. The black lines represent the best track, or what actually occurred. In both plots, the red line is closer to the black line than the blue one is, showing the forecast improvement.
- The new observation-based scheme (MEDMF-TKE) improved average forecasts intensity 3 days out by as much as 8 kt. This was because the new version produced stronger tropical cyclones that were closer to the observed intensity.
- The new scheme also produced track forecasts that were up to 20% better, including improved tracks for important cases like Hurricane Delta (Fig. 2).
- The new scheme also gave better forecasts of storm structure, with a reduction in the bias in the location of the strongest winds by up to 20 nautical miles.
- The new scheme produced stronger inflow (air spiraling into the hurricane at low levels) and stronger thunderstorms in the eyewall, which tends to lead to stronger hurricanes. This led to better prediction of cases that rapidly intensified (Fig. 1).
For more information, contact aoml.communications@noaa.gov. The study can be found at https://journals.ametsoc.org/view/journals/wefo/aop/WAF-D-21-0124.1/WAF-D-21-0124.1.xml.
The lead author was supported by the NOAA grant NA19OAR0220187. Jun Zhang was supported bytheNOAA Grant NA19OAR0220186 and ONR Grant N00014-20-1-2071.
