
This study looked at a collection (ensemble) of 80 runs of a hurricane model for Hurricane Dorian to learn why some got the forecast right and others got it wrong. The study shows how useful ensembles can be for understanding how hurricanes move, and also shows that it is critical to forecast what is happening around the tropical cyclone correctly in order to accurately predict its track 5 to 7 days later.

Figura 1: Los ciclones tropicales son "empujados" por el flujo que los rodea. Este esquema muestra cómo las vaguadas y las crestas afectan a su movimiento.
Summary: Hurricane Dorian in 2019 was a catastrophic hurricane for The Bahamas, and some early forecasts showed Dorian moving directly into or across Florida, while other forecasts correctly showed it stalling over The Bahamas and then turning northward. This track forecast uncertainty made preparations in Florida challenging; therefore, we wanted to better understand why Dorian took the track that it did. To do this, we looked at a collection (or ensemble) of 80 runs of, the Hurricane Analysis and Forecast System (HAFS), that all started at the same time. Since we can’t measure what is happening in the atmosphere everywhere, each ensemble member started with slightly different weather (what we call initial conditions) that agreed with the observations we had.
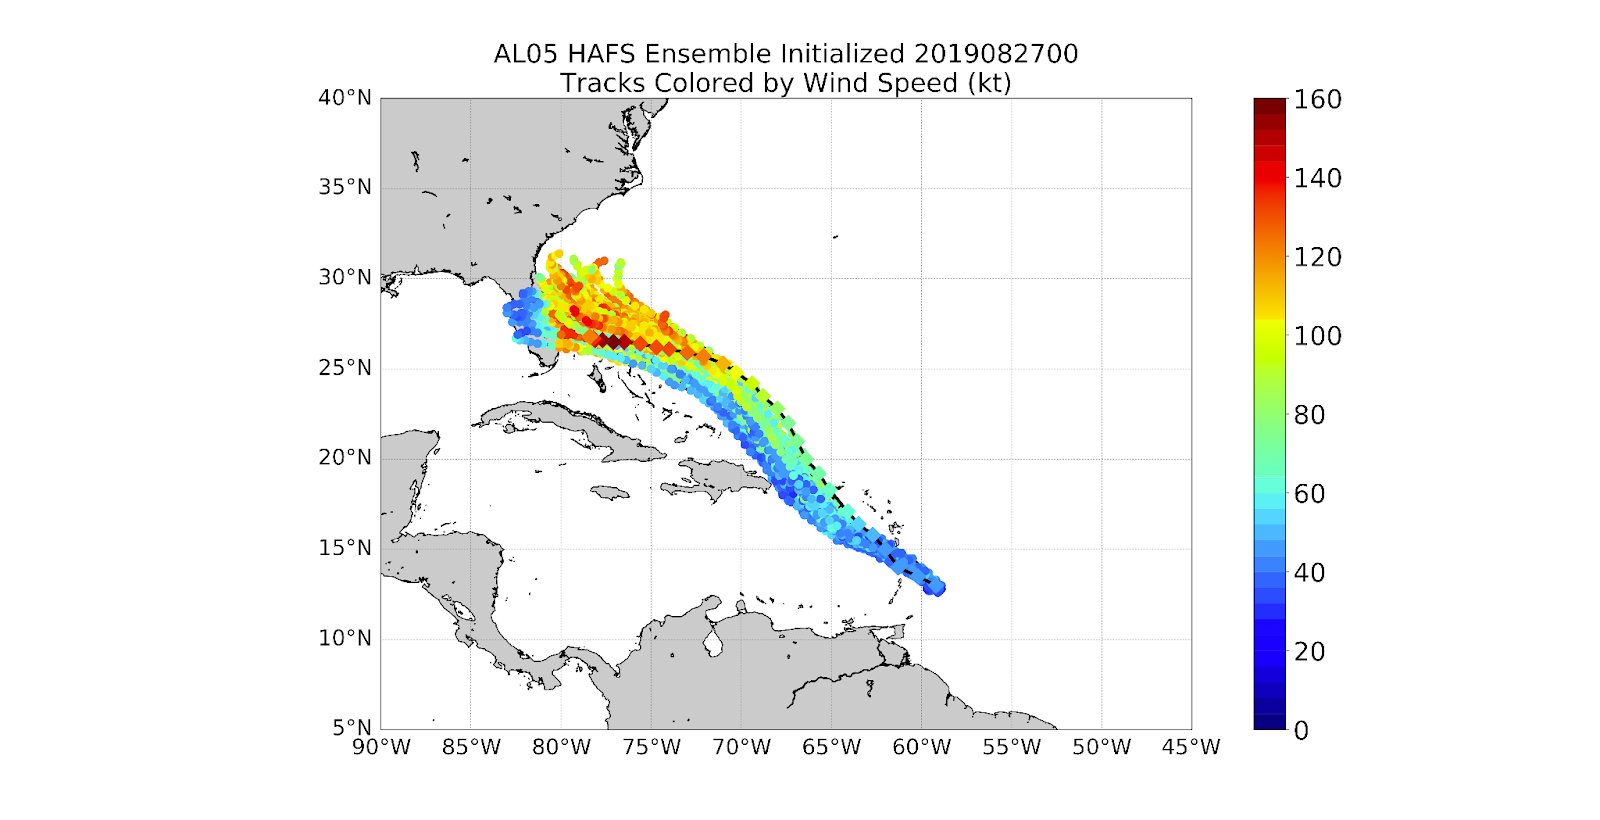
Figura 2: Rutas del huracán Dorian de los 80 miembros del conjunto HAFS, coloreadas por la velocidad máxima sostenida del viento de Dorian. Los diamantes muestran la posición e intensidad observadas.
Because hurricanes are steered by weather features around the storm (Fig. 1), we looked at differences between the ensemble members to see which ones caused the differences. Some of the ensemble members showed a forecast track of Dorian that was close to where it actually went, whereas others had different tracks – some moved northward too fast, some showed a track into Florida, and others stalled near the coast of Florida instead of over The Bahamas (Fig. 2).
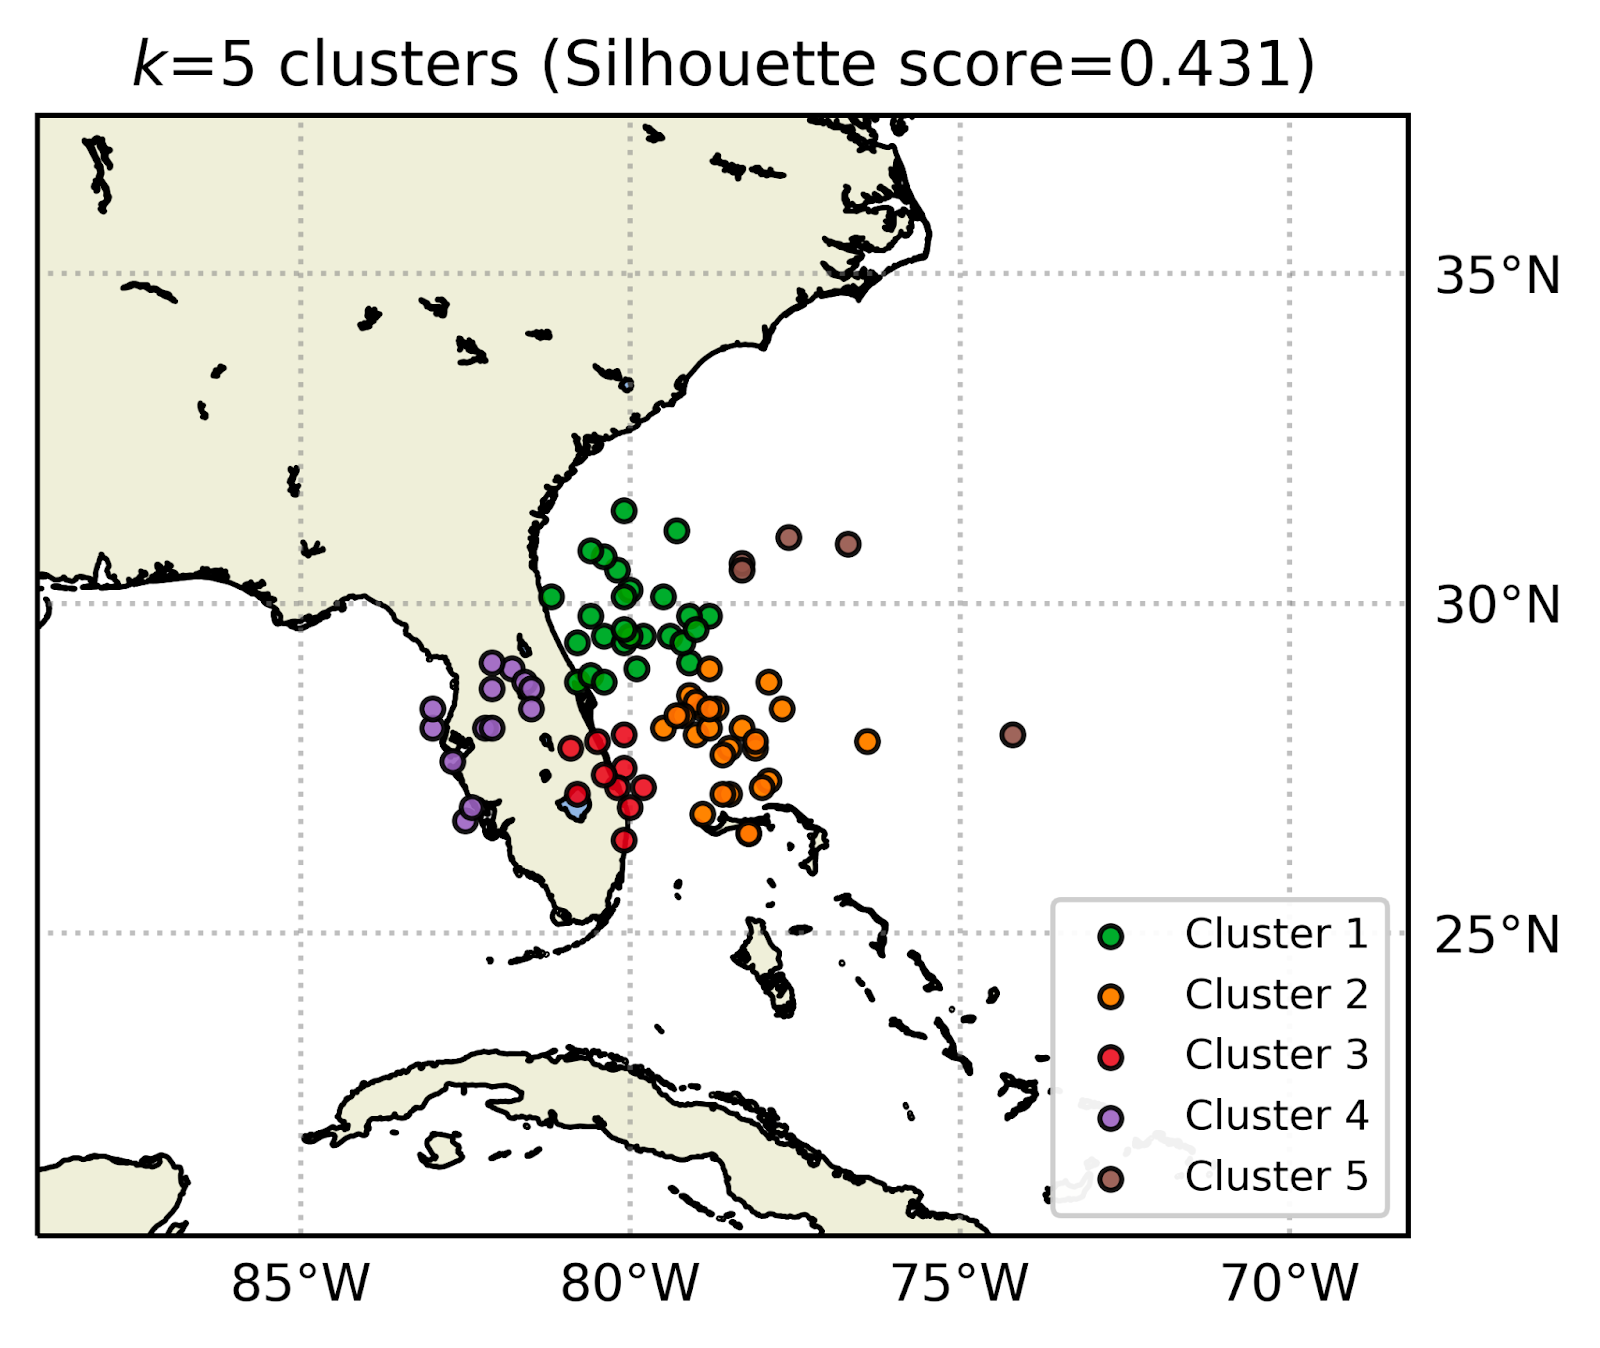
Figure 3: Clusters of ensemble members based on the 7-day forecast position of Dorian. The clusters were made using a machine-learning algorithm.
We also applied a special sensitivity analysis to determine which large-scale weather features at different time periods in the forecast were the most important for the final track of Dorian. This analysis can be applied in real-time to operational forecast ensembles to understand what large-scale patterns are important for steering a storm, but here we used it in research mode to help us better understand Dorian’s track.

Figure 4: “Sensitivity analysis” of the track of Hurricane Dorian. Dorian’s position 4 days into the forecast is shown by the pink diamond. Red areas indicate areas where stronger mid-level high-pressure (the subtropical ridge) 4 days into the forecast led to Dorian ending up further west at the end of the 7-day forecast. The areas that seemed most important were the subtropical ridge to the north of Dorian and the relatively low pressure at mid levels (a trough) over the East/Central U.S. A weaker trough and stronger ridge led to model tracks further west, while a weaker ridge and stronger trough led to model tracks further east.
Important Conclusions:
- The HAFS ensemble represented a variety of possible track outcomes from Hurricane Dorian (Fig. 2), with clusters of members near The Bahamas, Florida, and other nearby locations (Fig. 3).
- Contrary to some of our expectations before performing the study, Dorian moving further to the east than forecast while in the Caribbean Sea was not the reason that it later stayed further east later offshore of Florida.
- The sensitivity analysis (Fig. 4) showed that the strength of the ridge of high pressure steering Dorian, as well as a trough of low pressure over the Eastern US, were critical weather features that determined the track over The Bahamas.

For more information, contact aoml.communications@noaa.gov. The manuscript can be found at https://journals.ametsoc.org/view/journals/mwre/aop/MWR-D-22-0112.1/MWR-D-22-0112.1.xml. Andrew Hazelton was supported by NOAA grant NA19OAR0220187.