
This study uses a state-of-the-art hurricane modeling system developed at the NOAA/Atlantic Oceanographic and Meteorological Laboratory’s Hurricane Research Division, the Basin-Scale Hurricane Weather Research and Forecast (HWRF-B) model, to demonstrate a link between an oceanographic process called coastal downwelling and the intensification of tropical cyclones (TCs or hurricanes) near landfall. We show that coastal downwelling increases heat and moisture transfer into the atmosphere from the ocean ahead of TCs approaching land, creating conditions conducive to intensification even in the presence of inhibiting factors like strong vertical wind shear. These results indicate that understanding and modeling coastal downwelling can be important in forecasting TC intensity change before landfall.
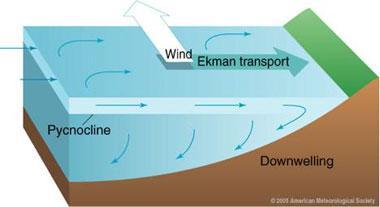
Figure 1: Schematic representation of coastal downwelling, caused by sea-surface winds blowing parallel to the coast and with the coast on their right. On our rotating earth, water near the surface is forced to the right of the wind (“Ekman transport”) and so toward the coast. This results in a “bulge” of elevated sealevel near shore (Ekman convergence), pushing the surface water downward and causing it to ultimately move offshore again at depth. Figure ©2001 American Meteorological Society.
Resumen:
Tropical cyclones (TCs or hurricanes) sometimes intensify (increase in maximum sustained surface wind speed) just before making landfall, and understanding how and why this happens can help us forecast such potentially dangerous events better. So, we examined model forecasts for three TCs that intensified as they approached land during the 2020 hurricane season. The energy that fuels TCs comes from the warm waters below. Past research has shown that the coastal ocean can play a role in intensification before landfall, causing cooling or warming of the surface water and thus modifying this energy available to the TC. Because of this, we used a coupled air-sea hurricane model system, which allows an atmospheric (air) model and an ocean (sea) model to communicate directly with each other to produce forecasts.

Figure 2: Ocean model fields for Hurricane Sally, dubbed 19L by the National Hurricane Center. Shading shows changes in sea-surface height in meters per day; dashed red lines show regions where surface currents are coming together (Ekman convergence, see Fig. 1), and blue lines show where surface wind speed was 34 kt or greater. Sally’s forecast track is in brown with triangle markers showing the forecast position at 6-h intervals. The left panel shows a time just prior to intensification, and the right column shows the forecast hour immediately after intensification.
Since the wind often blows along the coast when TCs are near land, we examined forecasts to see whether this would force water near the ocean surface to move toward shore in the model. Figure 1 shows a schematic representation of surface wind blowing parallel to, and with the coast on, the right. On our rotating earth, water near the surface is forced to the right north of the Equator (and to the left south of the Equator) of the wind because of the interaction of friction and the Coriolis acceleration (“Ekman transport”) and so will move toward the coast. A fuller explanation of Ekman transport can be found here.

Figure 3: Ocean temperature (shaded) and currents (arrows) prior to intensification for Hurricane Sally. The left panel shows sea surface temperature (SST) and surface currents. The red line shows where the profile in the middle column is. The right panel shows a side view of water temperature and currents along the profile; note the flow toward land (solid gray) and downward.
As the water moves toward shore, the water has nowhere to go, so the sea surface rises. Figure 2 shows that the surface currents come together near shore leading to the surface rising. As more and more water gathers toward shore, the surface continues to rise, or the water is pushed downward in a process known as coastal downwelling (Fig. 1). Figure 3 shows the effect of this coastal downwelling on both the currents and the water temperature over the continental shelf. and Fig. 4 shows how the energy from the warm ocean thus gathers near shore. This allows a TC to intensify even with high values of wind shear (the difference between the wind near the bottom and top of the TC) that usually leads to weakening.
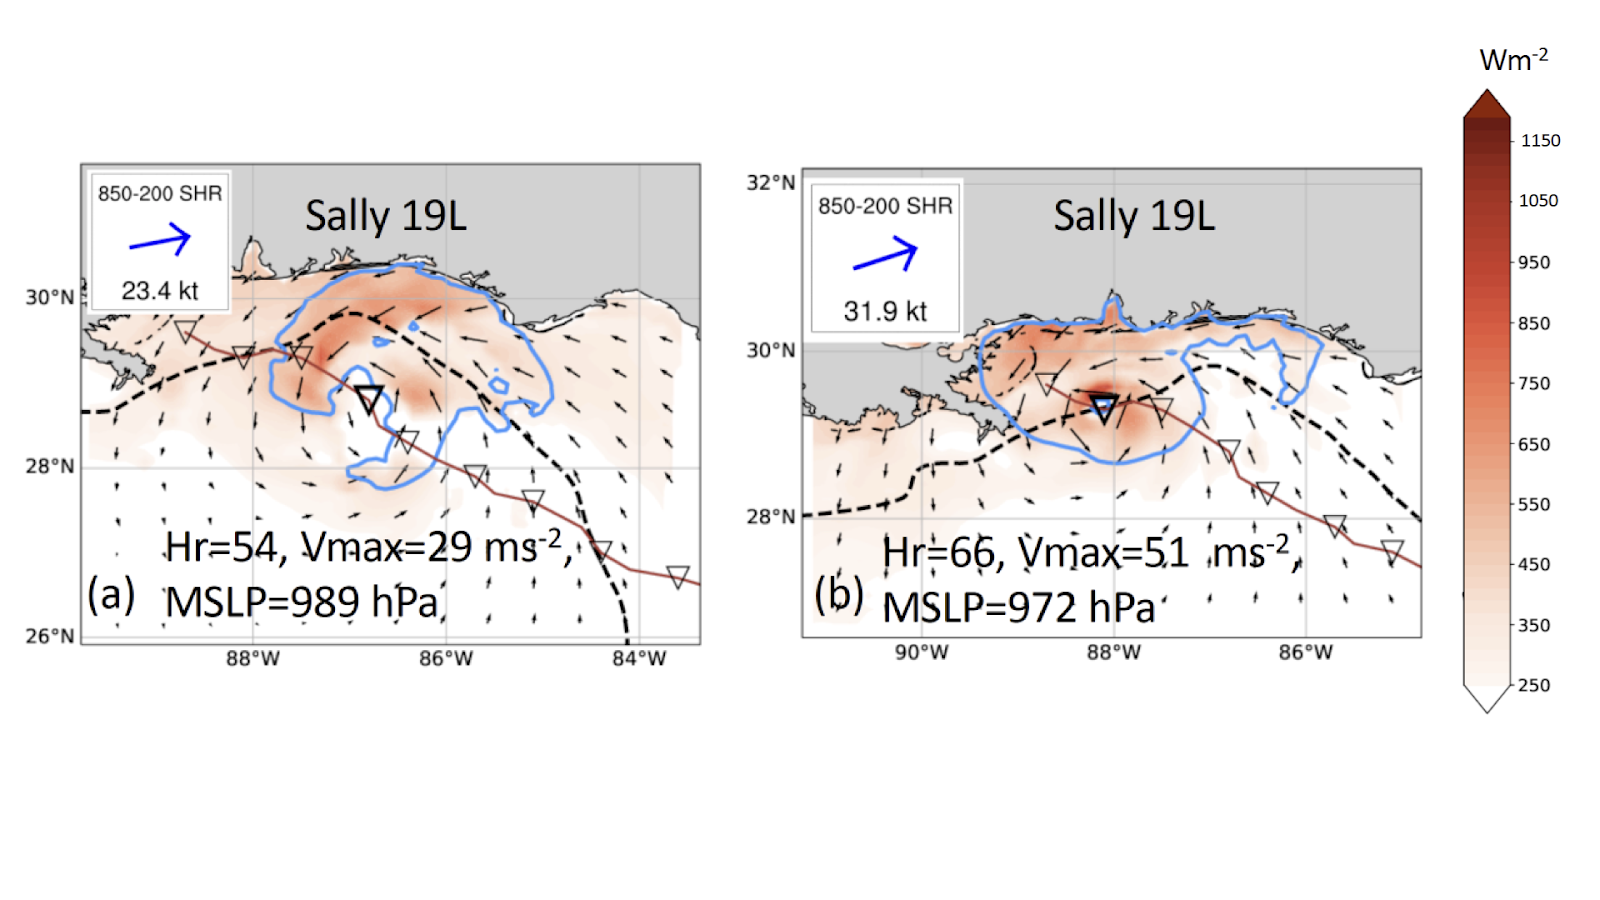
Figure 4: Total amount of energy transfer at the ocean surface (shading, in watts per square meter) for Hurricane Sally at the same times as Fig. 1. The region of tropical-storm-force (greater than 34 kt) surface wind speed is outlined in blue, and wind velocity is shown with black arrows. The forecast track is a brown line with triangles showing the center position every 6 h. Insets show the vertical wind shear, the difference between the wind near the bottom and the top of the hurricane.
Important Conclusions:
- Modeling what happens near shore when a hurricane approaches land can be important for skillfully predicting how much a hurricane will intensify.
- Continued observations of the coastal ocean using aircraft-deployed instruments, autonomous vehicles, and ocean moorings will be needed to improve representation of the coastal ocean in hurricane forecast models.
The authors wish to thank the Hurricane Forecast Improvement Program (HFIP) as well as funding from the Hurricane Supplemental, NOAA Grant NA19OAR0220187, NOAA Grant NA19OAR0220187, and ONR Grant N00014-20-6891-2071.
For more information, contact aoml.communications@noaa.gov. The full study can be found at https://agupubs.onlinelibrary.wiley.com/doi/10.1029/2021GL096630.
