Mission Summary
|
|||||||||||||||||||||||||||||||
| Chief Scientist | Michael Black |
| Radar/Doppler Scientist | John Gamache |
| GPS Dropsonde | Jimmy Franklin |
| Workstation | Paul Leighton |
| Observer | Stan Gedzelman, CCNY |
| Observer | Jim Eberwine, NWS/WSO Mt. Holly, NJ |
Mission Briefing
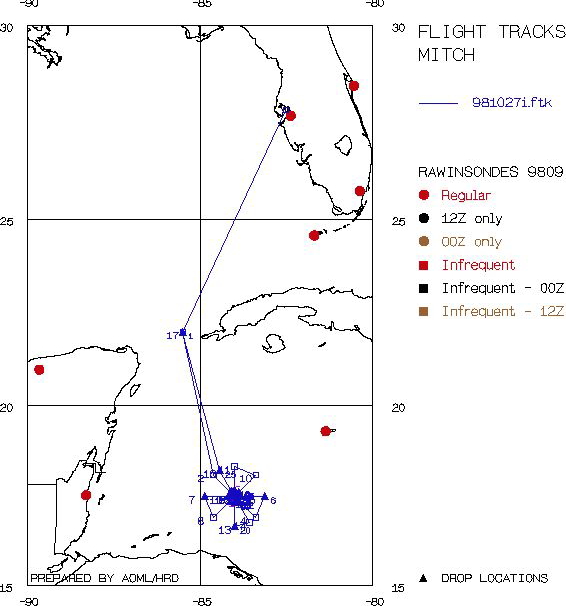
Fig. 1 Proposed flight track
On Monday, October 26, while Hurricane Mitch was intensifying to an October (Atlantic basin) record low pressure of 905 mb (and tied for the 4th strongest Atlantic hurricane with Camille, 1969), HRD decided to utilize the one available P-3, NOAA-43, and conduct a modified vertical motion experiment the following day. The primary objective was to collect flight level, Doppler radar, and GPS sonde observations in and around the eyewall of an unusually strong (possibly category 5) hurricane. Although we were too late in our planning to observe Mitch during the rapid-deepening phase (very difficult to forecast) and most storms remain at peak intensity for less than 24 hours, we decided that Mitch provided a good opportunity for research into eyewall structure and dynamics. Mitch was heading slowly SSW (see track) in the Caribbean Sea toward the coast of Honduras, with the likelihood of the storm stalling off the coast before being forecast to turn to the west and, eventually northwest toward the Yucatan Peninsula. We anticipated a NOAA G-IV surveillance mission to occur on the 27th and decided to takeoff from MacDill AFB at 1830 UTC on September 27 to collect data concurrent with the G-IV (the jet mission was canceled because of the proximity of Mitch to the Coast). The flight track (Fig. 1) consisted of a rotating figure 4 pattern with 50 nmi radial legs from the eye. GPS sonde drops would be placed at the endpoints of 4 of the legs (NNW, W, S, E) and at strategic points in the eyewall (Fig. 2). Three eyewall GPS dropwindsondes would be dropped in rapid succession (~20-30 sec apart) during three of the passes. In addition, 8 AXBTs were to be dropped in and around the eyewall to document the ocean response in an intense hurricane moving slowly over very warm (28°-30° C) water with a relatively deep (50-100 m) thermocline.
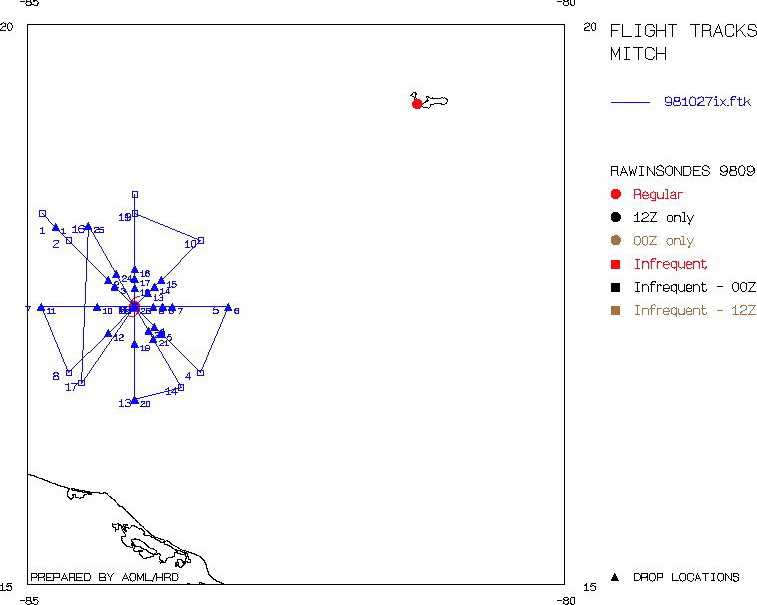
Fig. 2 Proposed flight track (detail)
Mission Synopsis:
| Take off | Landing
| MacDill AFB, FL | 17:44 UTC
| MacDill AFB, FL | 03:00 UTC
| | ||
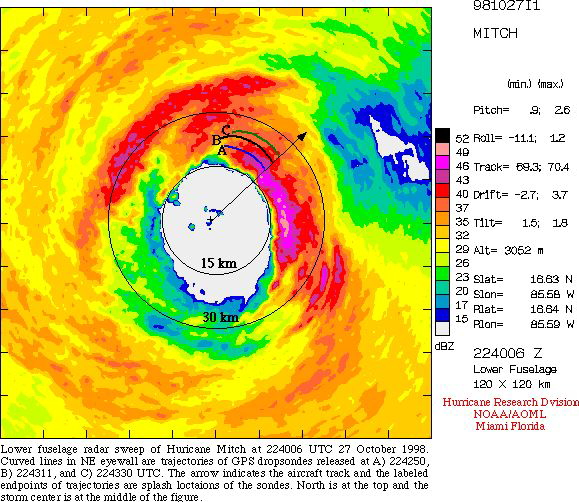
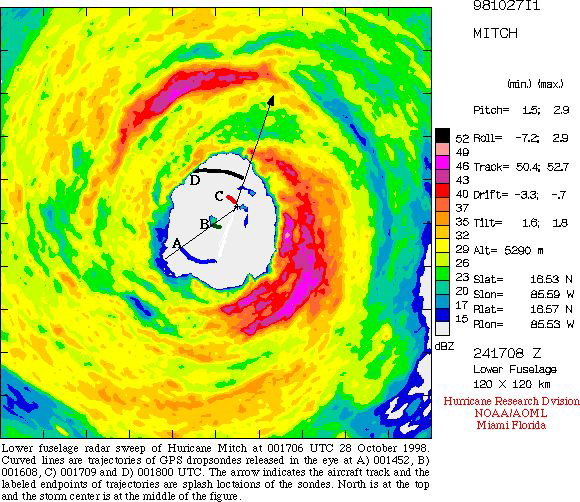
Takeoff from MacDill AFB, Florida was at 1744 UTC, the first GPS drop was at 2023 in the Yucatan Channel. Descending to our flight altitude of 10 kft we reached the initial point and first AXBT release of the figure 4 at 2124 UTC, ~50 nmi to the northwest of the eye. We entered the storm from the northwest, dropping an eyewall sonde and AXBT and reaching the eye at 2133 UTC where a dropsonde was released recording a surface pressure of 931 mb, ~25 mb higher than 24 hours before. The eye was filled with clouds from below, extending nearly up to our flight altitude. Above the plane, thin cirrus was visible in the eye. On radar, Mitch appeared asymmetric, with a 20-25 km diameter, elliptical (elongated N-S) eye and high (40-55 dBZ) reflectivities in the east eyewall, another band of heavy rain at 30 km radius in the NW quadrant, and light (<30 dBZ) reflectivities to the southeast of the eye (Fig. 3). This asymmetric pattern persisted throughout the flight (~ 4 h) with individual cells forming in the SE quadrant, rotating around to the north, where they dissipated. The vertical motion field was also asymmetric, with large and strong updrafts observed in the east eyewall and broad and strong downdrafts being found in the west eyewall.
 |
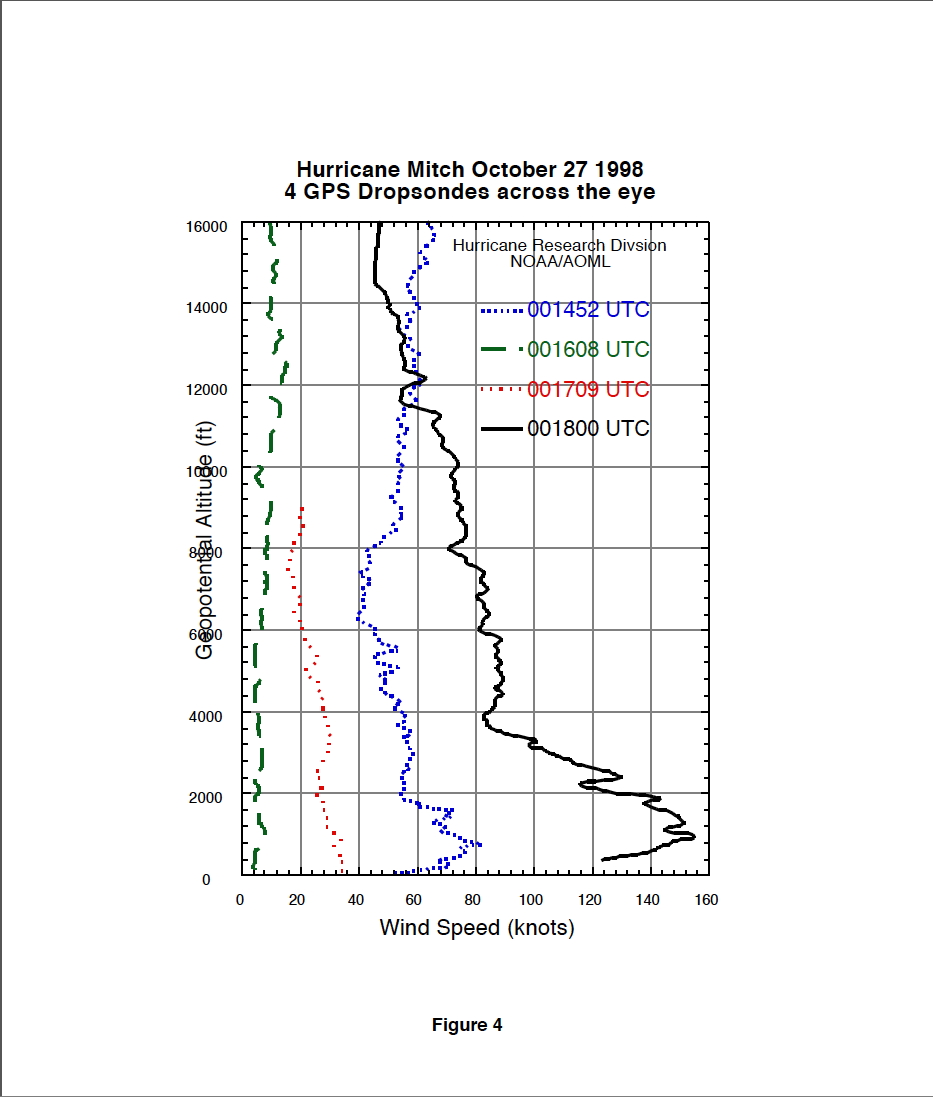 |
Peak flight-level winds were ~ 130 kts, but sustained winds were closer to 120 kts. Low level (~ 500 m) wind peaks were recorded by several of the eyewall dropsondes, the largest being over 180 kts in the northeast eyewall (Figs. 3 and 4), probably a record for a GPS dropsonde in a tropical cyclone. A total of 31 GPS sondes were dropped, including 20 in the eyewall, 6 in the eye, and 4 at 50 mile radii. Of the 6 eye drops, 4 were dropped in a south-north pass across the eye at 18000 ft from 00150018 UTC (Fig. 5). The last of these sondes was dropped in clear air inside of the northeast eyewall and as it fell, it rotated around to the inside edge of the northwest wall where it recorded winds of ~ 150 kts at altitudes of 100-500 m, even though it was still in the radar eye (Figs. 5 and 6).
 |
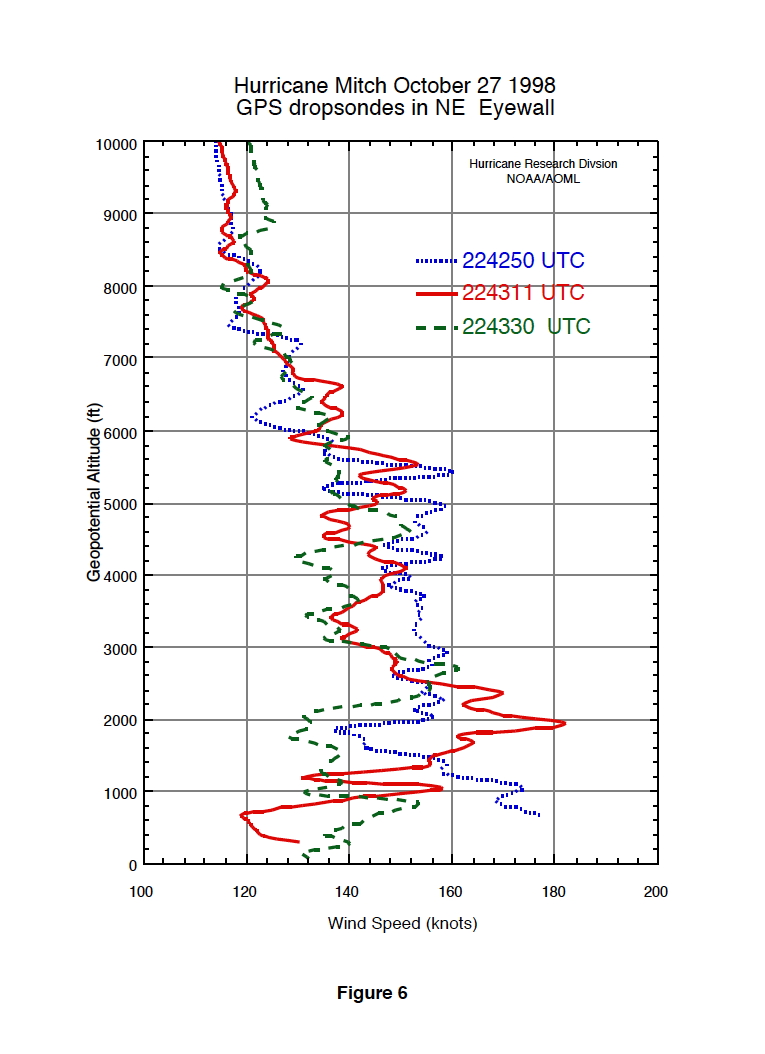 |
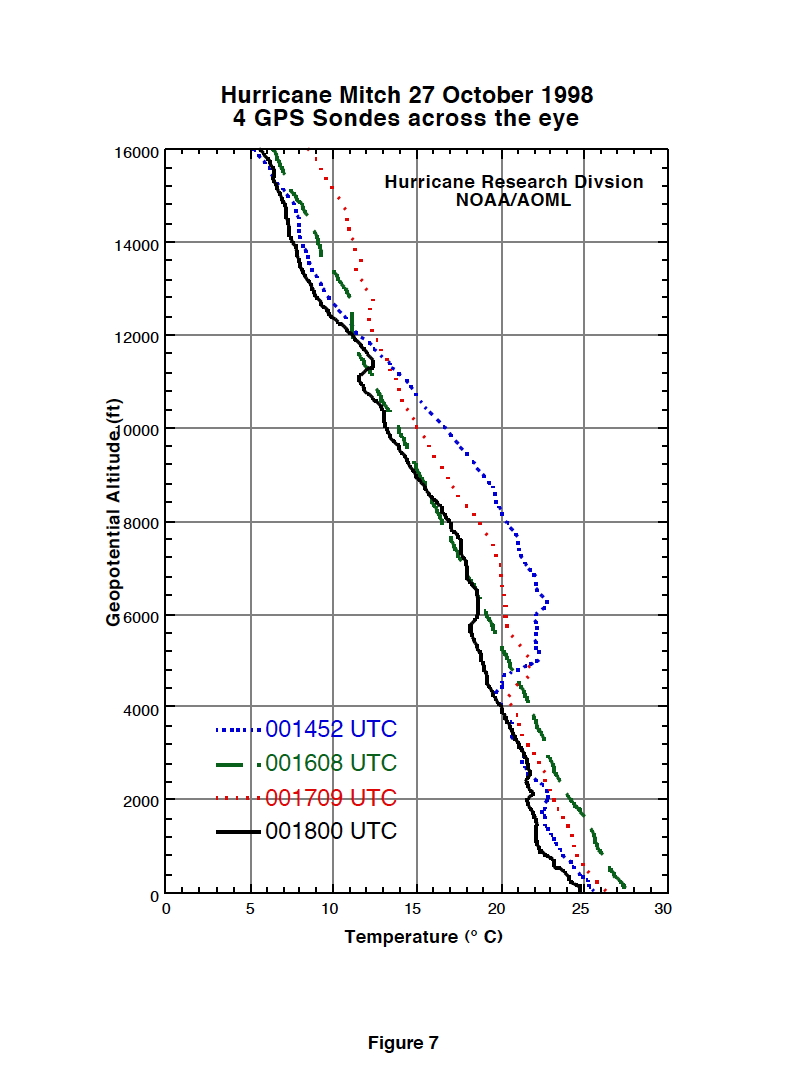
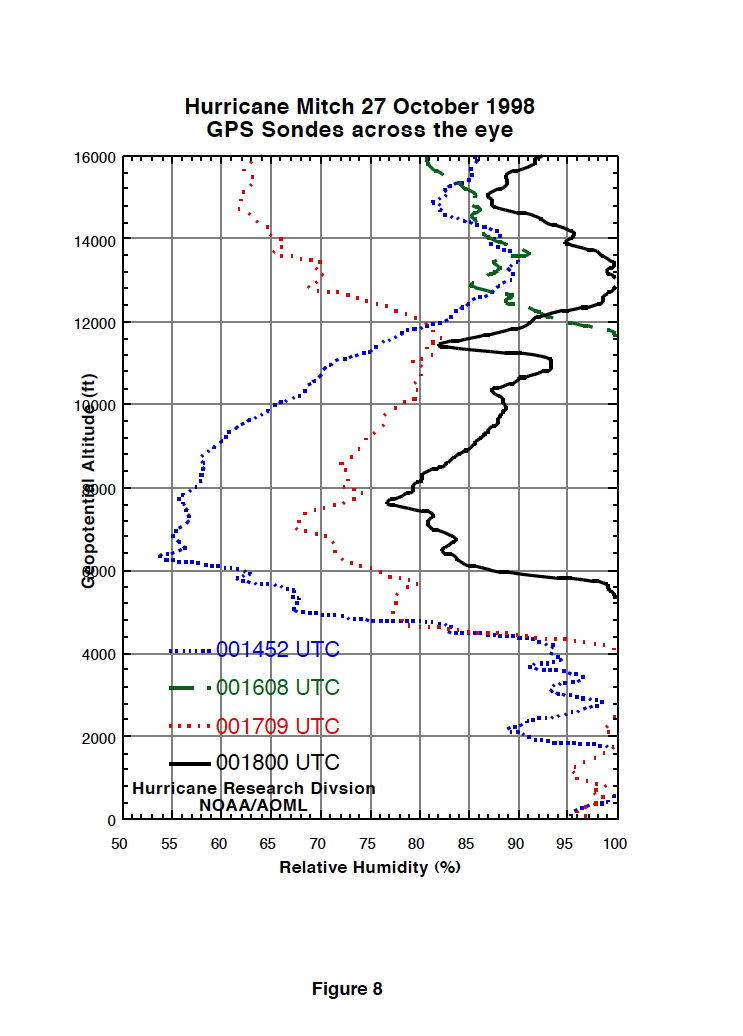
The temperature and relative humidity profiles from the 4 eye drops also provided interesting structure (Figs. 7 and 8). The driest air was found in the south part of the eye (001452 UTC) and, surprisingly, the air in the center of the eye (001608 UTC) reached saturation at 12,000 ft altitude. At low levels, the air was warmest near the center while at mid levels the temperature was warmer both north and south of the radar center. Overall, temperatures across the eye were coolest in the northern portion, very near the eyewall (001800 UTC). As in other intense, convective hurricanes, the eyewall drops recorded detailed wind structure with pronounced low-level (850-925 mb) maxima (Fig. 6). Of the 20 eyewall drops, 11 reached below 50 m height, a better success ratio than in hurricanes Guillermo or Georges (on Sept. 19), but still undesirable. In contrast, all of the eye and outer (50 nmi radii) sondes provided wind and thermodynamic data to the surface. Based on the eyewall soundings, the surface winds were ~135-140 kts (Category 5) even thought the pressure (928-931 mb) suggests that Mitch was a strong Category 4 storm at the time of this flight. In addition to the GPS drops, NOAA-43 deployed 8 AXBT's around the center, 4 at the endpoints at 50 nmi radius, 3 in the eyewall, and 1 in the eye. Six of these worked and recorded sea-surface temperatures between 28° and 29°C, except one that observed 26.5°C in the southwest eyewall in shallower water near the bay islands. The mixed-layer depth was estimated to be about 50-80 m for most of the AXBT profiles. After dropping the last of the eye drops, we circled in the eye until the data from the drops was received before heading out to the north and back to MacDill. We landed at 0300 UTC.
 |
 |
Evaluation
Although the P-3 flight was after both the rapid intensification and maximum intensity stage of Hurricane Mitch, HRD collected valuable information on eyewall structure and dynamics in an intense (Category 4 or 5) tropical cyclone. Observations of the asymmetric radar reflectivity, vertical wind profiles, and vertical air motions were recorded by the airborne lower-fuselage (LF) radar, tail Doppler radar, and GPS dropsondes. We transmitted to TPC/NHC two Extended Velocity Track Displays (radius-height Doppler wind analyses) and 4 lower-fuselage radar composites.
Problems
The radar systems went down for a few minutes twice, but not during any crucial times. Otherwise, the aircraft data systems performed well. More than half of the GPS eyewall dropsondes failed to transmit winds all the way to the sea surface. This problem was noted in other flights into intense hurricanes and is being investigated by HRD scientists and NCAR engineers. Possible causes are extreme turbulence and/or signal loss due to heavy precipitation. Nevertheless, the sondes provided observations of unusually strong winds at and near the surface and up to 50% greater than was recorded at the 10 k ft flight-level.
Michael Black
November 17,1998
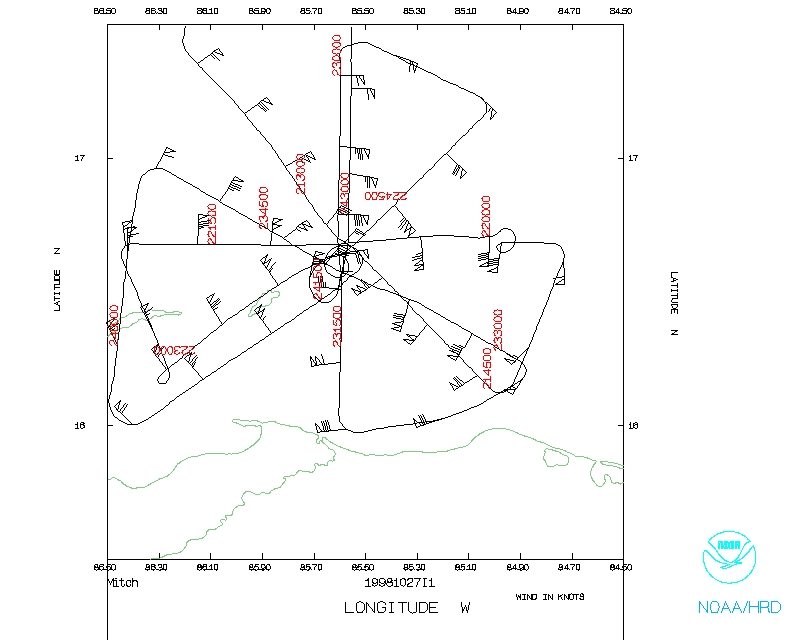 Flight track |
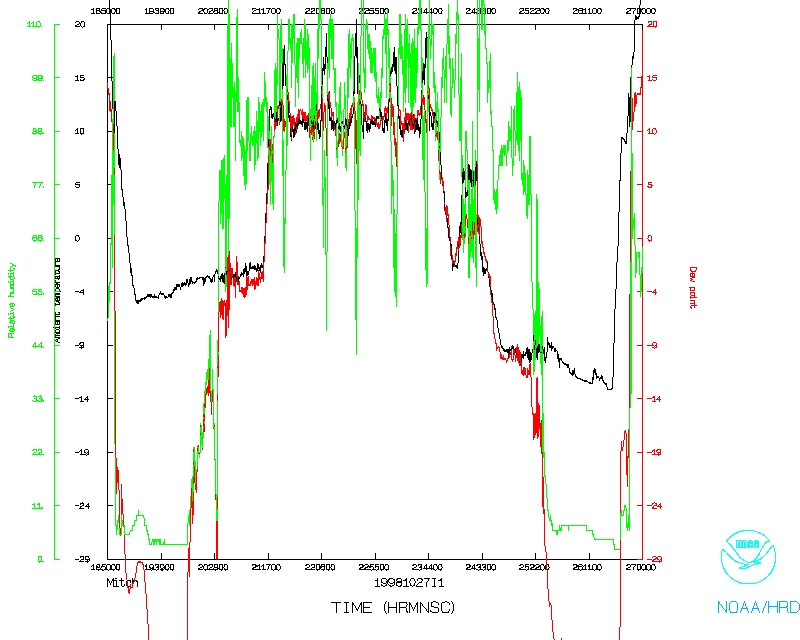 Temperature and Moisture |
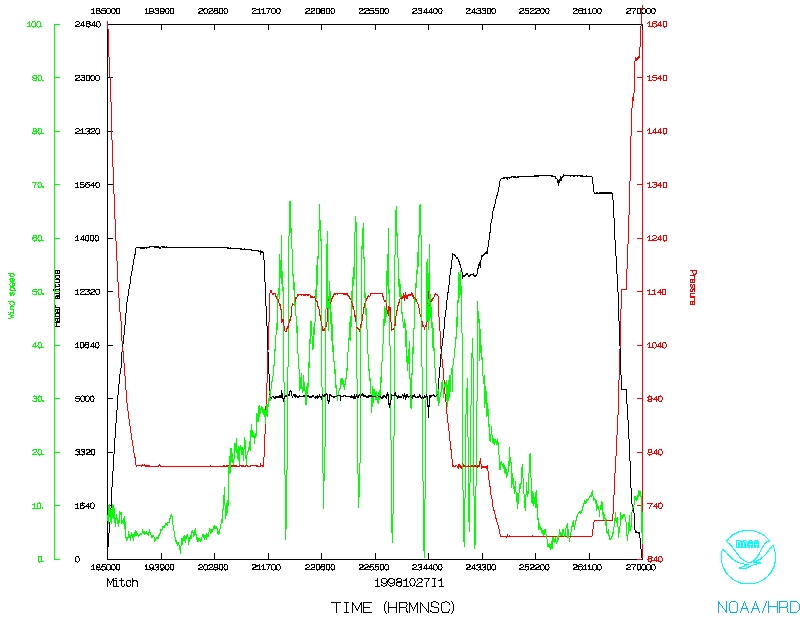 Wind and Atlitude |