AL03 /CHRIS MISSION HIGHLIGHTS
Four operationally tasked (by EMC) NOAA P-3 missions were flown into Tropical
Storm
Chris (AL03) to provide airborne Doppler radar and dropsonde observations to
initialize the operational Hurricane Weather Research and Forecasting (HWRF)
Model , spaced
every 12 hours, operating out of Lakeland, from approximately 0830 UTC (0430 AM
EDT) 8 July 2018 to 0430 UTC (12:30 AM EDT) 10 July 2018. Chris remained nearly
stationary off the U.S. east coast, just to the east of the Carolinas. Mission
IDs, approximate mission times, and accompanying GOES East infrared satellite
imagery are provided below:
Mission 1: 20180708H1
(0833- 1703 UTC)
|
Mission 2: 20180708H2
(2332 - 0452 UTC)
|
Mission 3: 20180709H1
(2030 - 0430 UTC)
|
Mission 4: 20180709H2
(o832 - 1552 UTC)
|
- Participating HRD Crew Sim Aberson (Radar Scientist),
Ghassan Alaka (LPS/Dropsonde Scientist), Bachir Annane (Dropsonde Scientist),
Hui Christophersen (LPS/Dropsonde Scientist), John Gamache (Ground Radar
Scientist), Nancy Griffin (Ground Radar Scientist), Frank Marks (Radar
Scientist), Paul Reasor (Ground Radar Scientist), Kelly Ryan (LPS), Jon
Zawislak (FPD). Three interns flew on missions: Miguel Cortez (NCAPS), Erin
Jones (Hollings), and Tyler Young (Hollings).
- A total of 55 dropwindsondes were launched over the 4 missions into
Chris (13 in 20180708H1, 6 in 20180708H2, 15 in 20180709H1, and 21 in
20180709H2). Most of the sondes were released from an altitude of 8000-10000
ft. 7 sondes were released from over 20 kft during a circumnavigation at 70
nmi from the center during the 20180708H1 mission, while 4 sondes were
released from 12 kft during a Figure 4 in the 20180709H2 mission.
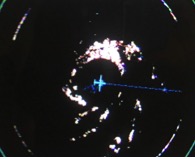
- Significant progress was made on the implementation of new Multi-mode
Radar (MMR) (replacement for the lower fuselage) for situational awareness,
thanks to the work by engineers from Harris and Elta onboard 20180709H1.
The improvement was significant enough that the MMR was subsequently used for
situational awareness by the Flight Directors and Pilots during that flight
and 20180709H2 (see figures below). Missions into Chris were also completed in
time for the MMR training to proceed at AOC. Numerous images of the MMR,
compared against the nose radar, are provided in the 'Mission Reports/Media"
folder under AL03/Chris in the HFP Document Repository.
Mission 2: 20180708H2
|
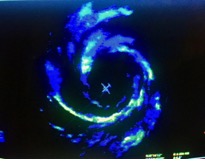 Mission 4: 20180709H2<
|
|
MMR images in the eye of TS Chris before and after the engineers fixed the
settings.
|
- All radar data was successfully transmitted to EMC for assimilation
into HWRF. Missions on 9 July were also the first to assimilate NOAA P-3 data i
nto H218, implemented for the 12Z cycle. Unfortunately, due to a missing
semicolon delimiter at the end of the ASPEN-generated WMO TEMPDROP messages,
some dropsondes from the 20180709H1 and 20180709H2 were not assimilated by
HWRF despite successful transmission off the aircraft.
In 20180709H2, HRD scientists on the ground discovered and then communicated
the problem to HRD scientists aboard the P-3, who proceeded to test a temporary
fix. The onboard P-3 dropsonde scientist appended the WMO messages with a
semicolon, and those 5 sondes were all found to be successfully assimilated.
Sondes without semicolons failed to assimilated. The issue is now being
discussed among all relevant parties (HRD, AOC, and EMC).
- While data transmission to EMC was the primary objective, there is some
relevant research that could be accomplished with the mission data.
Chris met the requirements for the HFP-IFEX "Early Stage Experiment", Science
Objective #1: Analysis of Intensification Processes Experiment. The storm
experienced gradual strengthening during the period
of the missions. During 20180708H1, the NHC intensity estimate increased from
35 to 40 kt. During 20180708H2, the NHC intensity increased to 50 kt. During
20180709H1, the NHC intensity remained at 50 kt. During 20180709H2, the
intensity had recently increased to 60 kt and remained steady during the
mission.
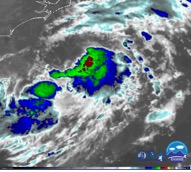
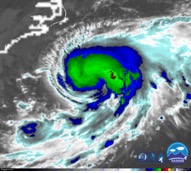
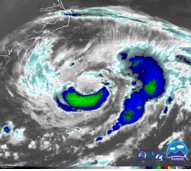
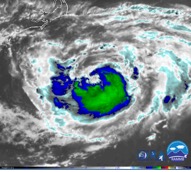
- As seen in the Figure 1,
Chris slowly intensified and became more organized during the flight period,
supported by an expanded, more symmetric wind field. During the first
mission (20180708H1), the precipitation distribution (Figure 2) was asymmetric
and the vortex was tilted to the east with height (Figure 3).
Subsequent missions
found less vortex tilt, and a more symmetric precipitation distribution (Figure
2). In the second mission (20180708H2), convective burst activity was
impressive and the circulation became more organized, supported by a more
symmetric distribution of precipitation (Figure 2). Over the 2 mission
days, the development of deep convection was observed in only one quadrant of
the storm, and this convection typically rotated around to the other quadrants.
Despite decreasing deep vertical wind shear (Figure 3), a
vertically-aligning vortex (Figure 3), and increased precipitation symmetry
(Figure 2), Chris did not intensify rapidly. One factor could be the intrusion
of dry air on 9 July. During the duration of the 20180709H1 mission,
precipitation distribution changed dramatically where heaviest convection
existed in the south and west quadrants at the beginning, whereas by the end of
the mission, the heaviest precipitation occurred in the east and north
quadrants. During the 20180709H2 mission, less precipitation was consistently
observed to the north. Cooling SSTs underneath the storm due to upwelling
while it remained stationary could be another factor limiting a more
substantial increase in intensity during the flight period (see Figure 4,
buoy SST time series).
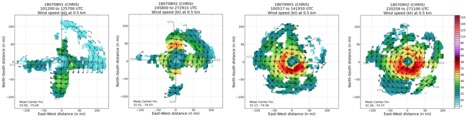
Figure 1. Sequence of composite storm-relative maps of 0.5-km windspeed
from each mission
|
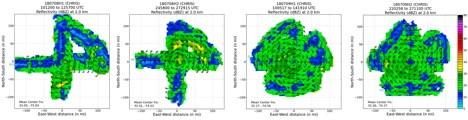
Figure 2. Sequence of composite reflectivity at 2 km from each mission
|
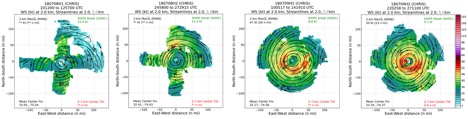
Figure 3. Sequence of composite wind at 2 km (color) and streamlines at 2
(black) and 5 km (gray) from each mission
|
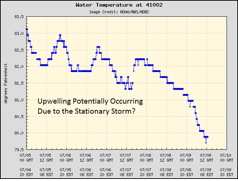
Figure 4. Water temperature at buoy 41002 in the storm, showing a decrease,
possibly due to upwelling
|
- A nearly full circumnavigation was executed during the first mission
(20180708H1), while the cloud and precipitation distribution was still
asymmetric. Unfortunately due to icing conditions, the P-3 had to descend
to a lower altitude for the eastern portion
of the circumnavigation after climbing and maintaining altitude above 20 kft on
the southern side of the storm. However, after reaching the northern side, the
P-3 was able to ascend back to 20 kft and complete the circumnavigation through
the western side. 7 out of 8 dropsondes were successfully deployed at 20 kft
during this time.
- The WSRA and 2nd SFMR (mounted in the belly) were functional during
these missions. However, the Doppler Wind LIDAR was not functional.
- Numerous issues with science workstations were encountered and addressed
during the 20180708H1 and 20180709H1 missions. HRD scientists worked
efficiently with other P-3 Crew to assure the success of data retrieval and/or
transmission.
- The importance and value of in-situ observations was highlighted by
these missions, as maximum wind measurements from the P-3 (e.g., dropsondes
and SFMR) validated satellite-based estimates, including the Automated Dvorak
Technique (ADT; Figure 5).
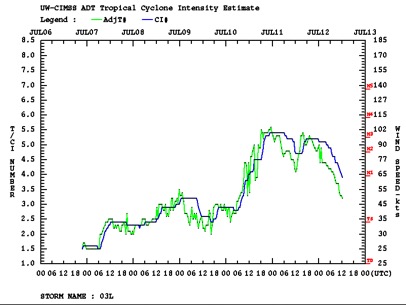
Figure 5. Advanced Dvorak Technique time series intensity estimates
|
Jon Zawislak
Field Program Director
Return to Tropical Storm Chris main page.
|
|