Skip to Content

Category Archives: Research Partnerships

Scientists Find Southern Ocean Removing CO2 from the Atmosphere More Efficiently

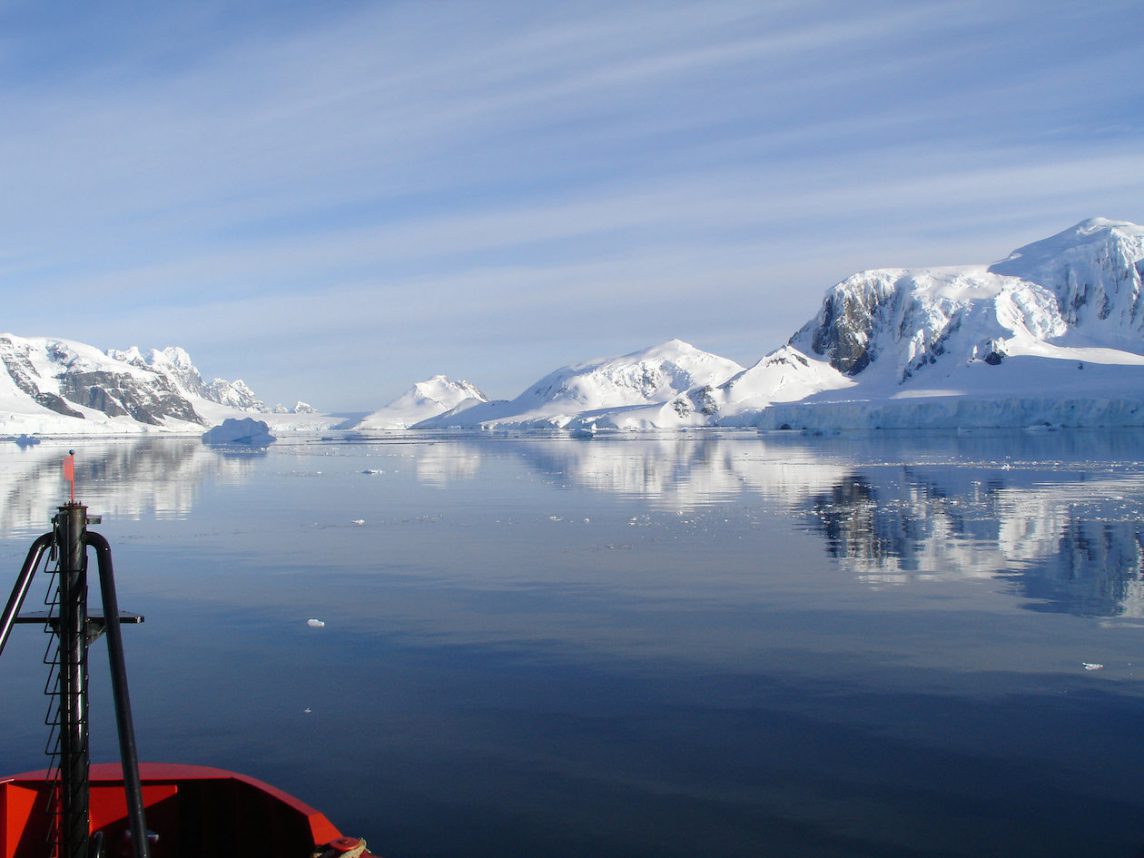
A research vessel ploughs through the waves, braving the strong westerly winds of the Roaring Forties in the Southern Ocean in order to measure levels of dissolved carbon dioxide in the surface of the ocean. (Nicolas Metzl, LOCEAN/IPSL Laboratory).

0 Continue Reading →

AOML Partners with NOAA Fisheries to Study Larval Fish in the Caribbean

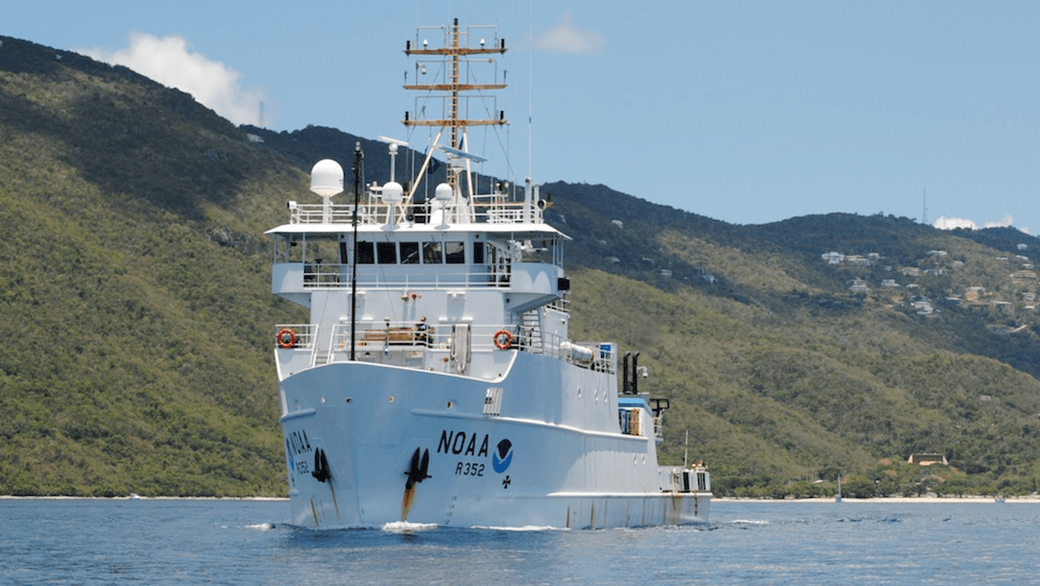
AOML is partnering with NOAA’s Southeast Fisheries Science Center (SEFSC) to conduct an interdisciplinary research cruise aboard the NOAA Ship Nancy Foster from April 11, 2015 through June 3, 2015. The cruise will begin in the U.S. Virgin Islands and extend westward across the northern Caribbean conducting various biological and physical oceanographic surveys.

Leg 1: U.S. Virgin Islands

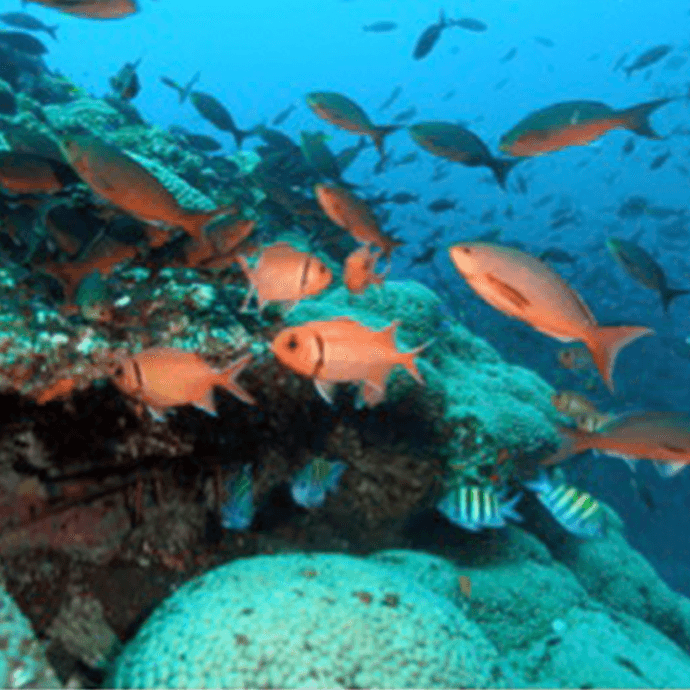
During the first leg of the cruise, NOAA oceanographers surveyed reef fish populations and ocean currents in the U.S. Virgin Islands. In particular, research focused on the Virgin Islands coastal shelf ecosystem where data collected will provide insight into the processes that drive spawning aggregations of economically important reef fish species in the region. Results from the expedition should also enhance scientists’ understanding of the differences in larval reef fish distributions between managed and non-managed areas of the coastal shelf. Armed with the data and accompanying knowledge of where “hot spots” of species richness and diversity are likely to occur in the seascape, the scientists are in a unique position to inform resource managers about the effectiveness of various approaches to managing living resources in the coastal shelf.

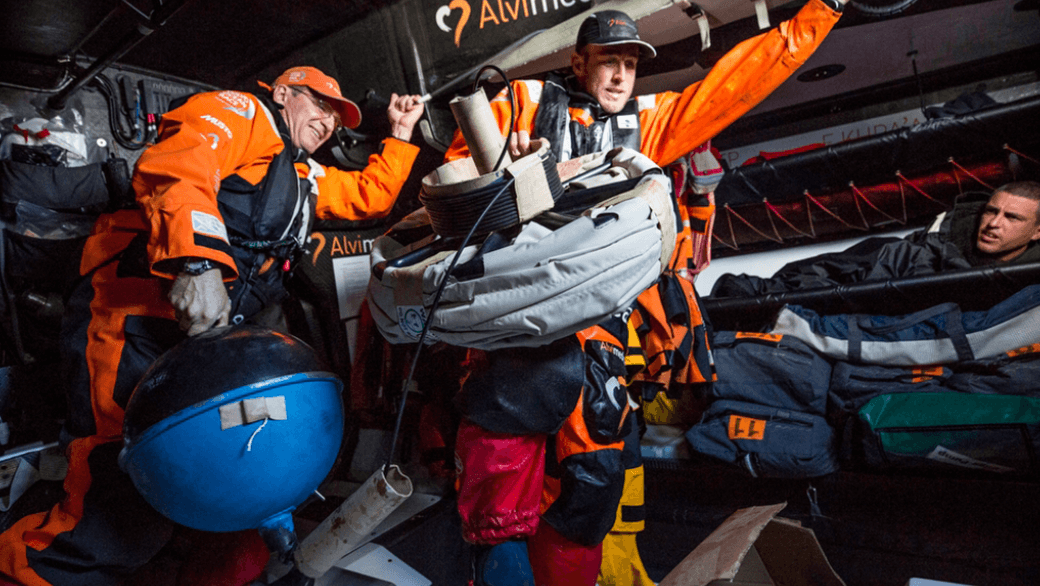
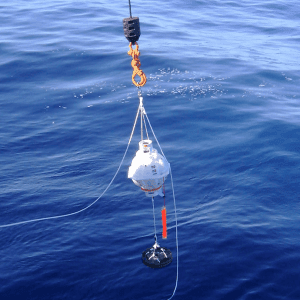
The reef fish larvae surveys involve casting a large net behind the vessel for 10-minute intervals. Scientists use a special kind of net known as a MOCNESS, which is a much-improved, high-tech version of the average sampling net. The letters in MOCNESS refer to the specific improvements: it’s a Multiple Opening and Closing Net, with an Environmental Sensing System. As MOCNESS tows behind the ship, each net can be opened and shut independently so that it samples a discrete patch of water. By using the environmental sensing system, the researcher can pinpoint exactly when and where to deploy the net. The sensing system is made up of an array of sensors mounted on the instrument frame that relays water conditions up to the ship in real time. The data also help researchers match what they find in their sample to the physical properties of the seawater.

After retrieving the nets, the contents are brought to the on board lab where scientists sample and document the species of fish. Scientists classified about 25,000 fish during each survey. This survey will build upon previous surveys conducted between 2007 and 2014, the resulting data of which is still being analyzed and studied. That data helps create a baseline for researchers to compare with new results. The long-term sustainability of fisheries in these banks will depend on the understanding of the transport, spawning aggregations and overall larval recruitment in these waters.

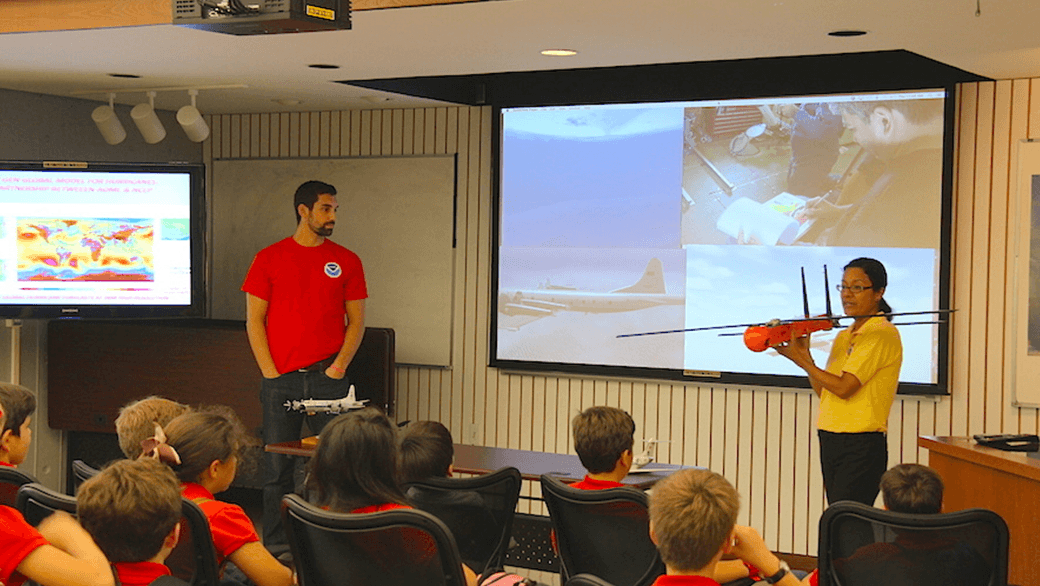
Aside from conducting surveys, NOAA oceanographers also participated in outreach opportunities with the local community. Students from Charlotte Amalie High School on St. Thomas toured the Nancy Foster and learned about the importance of larval reef fish. They even had a chance to examine larval specimens under a stereo-microscope and got a lesson in fish identification and classification.

Leg 2: Northern Caribbean

The second leg of the cruise began April 27th from Montego Bay, Jamaica and will take the team westward across the northern Caribbean, concluding in Cozumel, Mexico on May 5th. The biological focus of the research will shift from larval reef fish to the larvae of the pelagic Atlantic Bluefin Tuna. Oceanographers will continue to use the MOCNESS to collect their samples. Measurements and samples collected will provide species abundance and distribution data, and will help to improve tuna stock assessments for the western Caribbean Sea and Gulf of Mexico. The results will also be used to further develop a regional larval habitat model for Atlantic Bluefin Tuna.

Leg 3: Mexico/Mesoamerican Barrier Reef System

The third leg of the cruise began May 9th from Cozumel, Mexico. Oceanographers sampled along the Mesoamerican Barrier Reef System, the 2nd largest reef in the world, in an effort to learn more about the ecology and oceanography of this extremely diverse region. In this part of the Mesoamerican Barrier Reef, the rapidly moving Yucatan Current comes very close to shore, transporting fish larvae and other creatures. During this leg of the cruise, the focus on larval tuna continues but researchers will also sample larval lobster in an effort to measure species abundance and distribution data in the Mexican Caribbean.

In addition to NOAA participants, scientific collaborators from the University of Miami, the University of South Florida, the University of the Virgin Islands, the University of Oregon, the University of Puerto Rico, the University of the West Indies (Jamaica), the Department of Natural Resources (St. Thomas), the Colegio de la Frontera Sur (Mexico), the Instituto Nacional de Pesca (Mexico), and the Instituto Espanol de Oceanografia (Spain) will participate aboard the Nancy Foster as part of this interdisciplinary, multi-institutional, and international research cruise.

Originally Published in April 2015 by Edward Pritchard 

  • Panoramic sunset of the island of St. Thomas taken aboard the Nancy Foster. Image Credit: NOAA

  • Small Atlantic bluefin tuna larvae collected on the Mesoamerican Barrier Reef. Image Credit: NOAA

    The track of the Nancy Foster through the U.S. Virgin Islands over the course of Leg 1.

    Image Credit: NOAA

  • A translucent larval parrotfish under the microscope. Image Credit: NOAA


  • The Nancy Foster team deploys the MOCNESS net during Leg 2 in the northern Caribbean. Image Credit: NOAA


  • The NOAA ship Nancy Foster in St. Thomas, U.S. Virgin Islands. Image Credit: NOAA


  •  

0 Continue Reading →

Study Provides Local-scale Projections of Coral Bleaching Over the Next 100 Years

In a new study published April 1 in Global Change Biology, NOAA oceanographers and colleagues have developed a new method to produce high-resolution projections of the range and onset of severe annual coral bleaching for reefs in the Gulf of Mexico and Caribbean. The scientists built on a previous study that used global climate models from the Fifth Assessment Report of the Intergovernmental Panel on Climate Change that produced projections at a very coarse resolution of about 70 miles or 100 kilometers. By using a regional oceanic model and an approach called statistical downscaling, the scientists calculated when increasingly warmer waters would cause severe bleaching on an annual basis. The resulting local-scale projections of bleaching conditions, at a resolution of about 6 miles or 10 kilometers, will help managers include climate change as a consideration in planning and conservation decisions.

Coral bleaching is a major threat to coral ecosystems and primarily occurs when ocean temperatures are warmer than has been normal in the past. Temperature stress disrupts the relationship between corals and the algae that live within their tissues; a relationship that usually benefits both parties. The algae are expelled as they cannot photosynthesize under the extreme conditions. The white limestone coral skeleton becomes visible through tissue that is now transparent since the expelled algae give corals their vibrant colors. Extensive coral bleaching events, called ‘mass bleaching’, have increased in frequency and severity over the past two decades and have contributed to overall reef loss globally.

The loss of coral reefs results in significant ecological, social and economic loss. Coral reefs provide rich habitat for valuable fisheries that people depend on for food. They also serve as protective buffers to coastlines by absorbing wave energy from storms, and they boost local economies by attracting tourists who fish, dive and explore these underwater treasures.

A main conclusion of the study is that almost all coral reef locations in the Gulf of Mexico and Caribbean are projected to experience bleaching conditions every yearby mid-century. This result applies to the past coarse-resolution projections as well as the new high-resolution projections. However, the high-resolution projections show there is great within-country variation in the projected timing of extreme conditions. There are locations within many countries where some reefs are projected to experience annual bleaching conditions 15 or more years later than other locations. This applies to reefs in Florida, the Bahamas, Cuba, Puerto Rico, the Dominican Republic, Turks and Caicos, and Mexico. Reefs projected to experience bleaching conditions later are conservation priorities. These locations are a type of refuge, and are among the locations most likely to persist as the climate changes.

“At these locations, referred to in the study as ‘relative refugia’, lower rates of temperature increase and fewer extreme events mean reefs have more time to acclimate and adapt to climate change,” says study lead Dr. Ruben van Hooidonk, a coral and climate researcher with the Cooperative Institute for Marine and Atmospheric Studies at the University of Miami’s Rosenstiel School and NOAA’s Atlantic Oceanographic and Meteorological Laboratory.

Coastal and environmental managers, as well as conservation staff, throughout southern Florida, the Gulf of Mexico and Caribbean can now use the projections to identify local conservation priorities. Managers may decide to preferentially protect these locations within marine protected area networks or may target a range of other actions to these relative refugia to reduce stress caused by human activities.

Bob Glazer of Florida’s Fish and Wildlife Conservation Commission said he welcomed the new research. “Coral bleaching poses a grave threat to coral reefs and these high-resolution projections provide vitally needed spatial information about the degree of threat and inform opportunities to make better management decisions.”

The study authors also compare the two approaches they used to produce the high-resolution projections. Using the regional ocean model represents dynamical downscaling, which is state-of-art but is expensive in time, money and effort. The regional ocean model was developed by the Geophysical Fluid Dynamics Laboratory at NOAA and has been set up for use in the Gulf of Mexico and Caribbean by oceanographers at AOML.

In contrast, the statistical downscaling method the authors developed uses observed relationships between historical temperatures and current conditions to modify the outputs from the global climate models. This method has the advantage of being far less resource-intensive than dynamical downscaling. The study authors found that the results from the two very different approaches were very similar. This gives the team confidence that statistical downscaling should be applied for all of the world’s coral reefs, which the team plans to undertake over the coming year.

NOAA’s Reef Manager’s Guide, which provides information on the causes and consequences of coral bleaching, outlines some of the management strategies and tools that can help reef managers address the coral bleaching threat. Find out more here.This study was funded by NOAA’s Coral Reef Conservation Program and supported by NOAA AOML. The Open Access paper can be downloaded by clicking the thumbnail to the left.

Originally published April 1st, 2015 by Edward Pritchard

0 Continue Reading →

Drifter Program Catches a Lift to the Southern Ocean with the Volvo Ocean Race

If you’ve ever sailed aboard a ship in the coastal ocean, or checked a weather report before going to the beach, then you are one of many millions of people who benefit from ocean observations. NOAA collects ocean observations and weather data to provide mariners with accurate forecasts of seas, as well as coastal forecasts and even regional climate predictions. It takes a lot of effort to maintain observations in all of the ocean basins to support these forecasts, and NOAA certainly can’t do it alone. Partnerships are essential to maintaining a network of free-floating buoys, known as drifters, and NOAA’s latest partner is not your typical research or ocean transportation vessel: the six sailboats and crew currently racing around the world in the Volvo Ocean Race.

As one of the world’s major global sailing races, the Volvo Ocean Race greatly depends on accurate predictions of ocean currents and marine weather. All six of the Volvo Ocean Race teams will each deploy a drifter, a free-floating sensor that measures surface pressure and ocean currents and transmits the information by satellite to NOAA, during the fifth leg of the race, in the Southern Ocean – a region oceanographers don’t get to visit regularly, but one that is important to observe.

  • Sailors from Team Alvimedica deploy a drifter in the Southern Ocean.

    Image credit: Amory Ross/Volvo Ocean Race

  • Deployment site for drifters on Volvo Ocean Race 2014-2015 Route Map. Image Credit: Volvo Ocean Race and NOAA/AOML

Update from the Southern Ocean:

On March 20th, despite less than ideal conditions, sailors aboard the six sailing vessels successfully deployed drifters at target locations in the Southern Ocean.

Will Oxley, Team Alvimedica’s navigator, was excited to participate in the drifter deployment. Aside from being a top offshore sailor, Oxley is a marine biologist who recognizes the importance of data collection in the Southern Ocean.

“It’s believed the Southern Ocean absorbs up to about 60 percent of the heat and carbon dioxide produced by humans,” he explains. “So the Southern Ocean is a very important ‘sink’ that is absorbing carbon dioxide and slowing the pace of global warming.”

NOAA scientists will soon be receiving critical real-time data from some of the most remote waters on the planet. Access the drifter data online by clicking on the thumbnail.

Originally Published March 2015 by Shannon Jones

0 Continue Reading →

Gulf of Mexico Marine Food Web Changes Over the Decades

New NOAA study finds natural climate cycles and

human activities are drivers of change

Scientists in the Gulf of Mexico now have a better understanding of how naturally-occurring climate cycles–as well as human activities–can trigger widespread ecosystem changes that ripple through the Gulf food web and the communities dependent on it, thanks to a new study published Saturday in the journal Global Change Biology.

A team of NOAA oceanographers spent three years reviewing over 100 indicators derived from environmental, fishery, and economic data, including sea surface temperature, currents, atmospheric patterns, fishing effort, harvest, and revenues. Through extensive analysis, they found a major ecosystem reorganization that appeared to be timed with a naturally-occurring climate shift that occurred around 1995.

The climate phenomenon is known as the Atlantic Multidecadal Oscillation (AMO), a climate signal in the North Atlantic Ocean that switches between cool and warm phases, each lasting for 20-40 years at a time. The AMO, which was in a cool phase between 1965 until 1995 and has been in a warm phase since, influences global ocean and weather conditions in the northern hemisphere such as hurricane activity in the Atlantic ocean and the severity and frequency of droughts.

However, the AMO is not as extensively studied as other climate phenomena, such as El Nino, and this study is the first to investigate what scientists hope will be many future studies examining how the AMO influences ecosystem-scale change in the Gulf. Scientists hope this work will spur interest in further studying this phenomenon and its implications for the marine environment in this region.

“These major ecosystem shifts have probably gone unrecognized to date because they are not apparent when considering single species or individual components of the ecosystem,” said lead investigator Dr. Mandy Karnauskas of NOAA’s Southeast Fisheries Science Center. “Only when we put a lot of things together — including currents, hypoxia, fish abundances, fishing effort, and more — does a strong climate signal emerge.”

Additionally, scientists observed shifts in many species around the late 1970s coincident with the advent of the U.S. Magnuson-Stevens Fishery Conservation and Management Act– a policy designed to set rules for international fishing in U.S. waters, make the expansion of certain fisheries more favorable for economic development, and ensure the long-term sustainability of the nation’s fish stocks.

Other human influences that are not as pronounced–or easily distinguishable–include coastal development, agricultural runoff, oil spills, and fishing. Natural phenomena like coastal storms and hurricanes play a role as well.

The scientists expect their study to be useful to resource managers throughout the Gulf region. While managers cannot control Earth’s natural climate cycles, they may need to consider how to alter management strategies in light of them, in order to effectively meet their mandates.

Karnauskas’ team included other scientists from NOAA Fisheries as well as NOAA’s Atlantic Oceanographic and Meteorological Laboratory, the University of Miami, and the University of Texas.

Click on the thumbnail to the left to download the full study.

Originally Published in March 2015 by Shannon Jones

0 Continue Reading →

NOAA and Partners Host Open House for 1,300

NOAA’s Atlantic Oceanographic and Meteorological Laboratory (AOML) and the National Marine Fisheries Service/Southeast Fisheries Science Center (SEFSC) partnered with the University of Miami Rosenstiel School for Marine and Atmospheric Science and the Maritime and Science Technology (MAST) Academy to host an open house May 14th-16th. The three day event brought an estimated 1,300 people to Virginia Key to learn about a variety of scientific topics including hurricane research, climate science, oceanography, local fisheries, coral communities, and endangered species. NOAA and UM scientists were on-hand to describe their research projects, conduct hands-on experiments, and answer questions.

Over 700 students from fourteen local schools participated in the event. Small groups toured AOML, SEFSC, the MAST Academy Land SHARC and Weather on Wheels mobile outreach programs and the University of Miami’s new Marine Technology and Life Sciences Seawater Complex. Doors were then opened up to the public on Saturday, May 16th. Saturday’s event was an interactive experience for all age groups, with visitors rotating throughout each NOAA facility, the MAST mobile outreach buses, and the University of Miami Rosenstiel School’s experimental hatchery. Among the visitors were over 225 boy scouts and girl scouts from local troops, each of whom earned a special science patch for their participation in the event. school groups enjoyed the open house on Thursday and Friday, May 14th-15th.

This event brought marine and atmospheric science to the community and further enhanced Science, Technology, Engineering and Math (STEM) education. We’d like to thank all participants as well as our dedicated staff and volunteers for making this such an exciting event!


Originally Published in January 2015 by Shannon Jones

0 Continue Reading →

Meridional Overturning Circulation: Following the Heat

Deployment of a PIES mooring in the South Atlantic. Photo credit: NOAA/AOML

If you want to understand Earth’s climate and how it changes from year-to-year and decade-to-decade, look to the oceans, and follow the heat. The major driver in the redistribution of heat around the globe in the ocean-climate system is Meridional Overturning Circulation, or MOC. The MOC is a vertical circulation pattern that exchanges surface and deep waters via poleward movement of surface waters. As an example, the well known Gulf Stream on the eastern seaboard of North America carries warm water northward to the Greenland and Norwegian Seas, where it cools and sinks.

Scientists with AOML’s Physical Oceanography Division joined with partners from Argentina and Brazil in October to study the MOC at 34.5°S in the South Atlantic. On board the Argentine research vessel ARA Puerto Deseado, researchers united for the ninth joint cruise undertaken in support of the NOAA-funded Southwest Atlantic MOC (SAM) project since March 2009. Participants included researchers from the Universidade de Buenos Aires, the Servicio de Hidrografía Naval, the Instituto Nacional de Investigación y Desarrollo Pesquero, the Universidade Federal do Rio Grande, and the Universidade de Sao Paulo, as well as NOAA-AOML.

The MOC sinks at high latitudes and upwells elsewhere. Its variability is linked in numerical models to significant changes in precipitation patterns, surface air temperatures, and hurricane intensity over large portions of the Earth. NOAA-AOML serves in a leading role with its partners to collect observations of the South Atlantic portion of the global MOC system to gain a more complete understanding of its complex nature. A complete trans-basin instrument array to measure the MOC at 34.5°S is in the process of deployment, and NOAA instruments near the western boundary are the cornerstone of the full array.

On this fall 2014 cruise, scientists used ship-based instruments to acoustically download data from four pressure-equipped inverted echo sounder (PIES) moorings in the SAM array, as well as two similar Brazilian instruments. These instruments send sound pulses from their position near the ocean floor to the sea surface and listen for the return of the reflected sound waves. The round-trip acoustic travel time measurements are then combined with historical hydrographic data to obtain daily estimates of the temperature, salinity, and density for the full water column above the mooring. Meanwhile, the pressure gauges provide information on the variability of deep-water flows. The combination of data sets from the PIES moorings provides long-term observations of the shallow and deep western boundary currents at 34.5°S, key components in the MOC system.

The existing array is scheduled to continue through at least 2016, with annual or semi-annual cruises planned to collect new hydrographic information and acoustically download data from the array. NOAA’s contribution to this effort is funded by the Climate Program Office/Climate Observations Division and by AOML.

Originally Published in November 2014 by Shannon Jones

0 Continue Reading →

Atlantic Hurricane Season Remains Quiet As Predicted

Improved model, new surge forecast products and research projects debuted


The Atlantic hurricane season will officially end November 30, and will be remembered as a relatively quiet season as was predicted. Still, the season afforded NOAA scientists with opportunities to produce new forecast products, showcase successful modeling advancements, and conduct research to benefit future forecasts.

“Fortunately, much of the U.S. coastline was spared this year with only one landfalling hurricane along the East Coast. Nevertheless, we know that’s not always going to be the case,” said Louis Uccellini, Ph.D., director of NOAA’s National Weather Service. “The ‘off season’ between now and the start of next year’s hurricane season is the best time for communities to refine their response plans and for businesses and individuals to make sure they’re prepared for any potential storm.”

How the Atlantic Basin seasonal outlooks from NOAA’s Climate Prediction Center verified:


Actual

August Outlook

May Outlook

Named storms (top winds of 39 mph or higher)

8

7-12

8-13

Hurricanes (top winds of 74 mph or higher)

6

3-6

3-6

Major hurricanes (Category 3, 4, 5; winds of at least 111 mph)

2

0-2

1-2


“A combination of atmospheric conditions acted to suppress the Atlantic hurricane season, including very strong vertical wind shear, combined with increased atmospheric stability, stronger sinking motion and drier air across the tropical Atlantic,” said Gerry Bell, Ph.D., lead hurricane forecaster at NOAA’s Climate Prediction Center. “Also, the West African monsoon was near- to below average, making it more difficult for African easterly waves to develop.”

Meanwhile, the eastern North Pacific hurricane season met or exceded expectations with 20 named storms – the busiest since 1992. Of those, 14 became hurricanes and eight were major hurricanes. NOAA’s seasonal hurricane outlook called for 14 to 20 named storms, including seven to 11 hurricanes, of which three to six were expected to become major hurricanes. Two hurricanes (Odile and Simon) brought much-needed moisture to the parts of the southwestern U.S., with very heavy rain from Simon causing flooding in some areas.

“Conditions that favored an above-normal eastern Pacific hurricane season included weak vertical wind shear, exceptionally moist and unstable air, and a strong ridge of high pressure in the upper atmosphere that helped to keep storms in a conducive environment for extended periods,” added Bell.

In the central North Pacific hurricane basin, there were five named storms (four hurricanes, including a major hurricane, and one tropical storm). NOAA’s seasonal hurricane outlook called for four to seven tropical cyclones to affect the central Pacific this season. The most notable storm was major Hurricane Iselle, which hit the Big Island of Hawaii in early August as a tropical storm, and was the first tropical cyclone to make landfall in the main Hawaiian Islands since Hurricane Iniki in 1992. Hurricane Ana was also notable in that it was the longest-lived tropical cyclone (13 days) of the season and the longest-lived central Pacific storm of the satellite era.


New & improved products this year

As part of its efforts to provide better products and services, NOAA’s National Weather Service introduced many new and experimental products that are already paying off.

The upgrade of the Hurricane Weather Research and Forecasting (HWRF) model in June with increased vertical resolution and improved physics produced excellent forecasts for Hurricane Arthur’s landfall in the Outer Banks of North Carolina, and provided outstanding track forecasts in the Atlantic basin through the season. The model, developed by NOAA researchers including AOML’s Hurrican Research Division, is also providing guidance on tropical cyclones in other basins globally, including the Western Pacific and North Indian Ocean basins, benefiting the Joint Typhoon Warning Center and several international operational forecast agencies. The Global Forecast System (GFS) model has also been a valuable tool over the last couple of hurricane seasons, providing excellent guidance in track forecasts out to 120 hours.

In 2014, NOAA’s National Hurricane Center introduced an experimental five-day Graphical Tropical Weather Outlook to accompany its text product for both the Atlantic and eastern North Pacific basins. The new graphics indicate the likelihood of development and the potential formation areas of new tropical cyclones during the next five days. NHC also introduced an experimental Potential Storm Surge Flooding Map for those areas along the Gulf and Atlantic coasts of the United States at risk of storm surge from an approaching tropical cyclone. First used on July 1 as a strengthening Tropical Storm Arthur targeted the North Carolina coastline, the map highlights those geographical areas where inundation from storm surge could occur and the height above ground that the water could reach.

Beginning with the 2015 hurricane season, NHC plans to offer a real-time experimental storm surge watch/warning graphic for areas along the Gulf and Atlantic coasts of the United States where there is a danger of life-threatening storm surge inundation from an approaching tropical cyclone.


Fostering further improvements

While this year’s hurricane season was relatively quiet, NOAA scientists used new tools that have the potential to improve hurricane track and intensity forecasts. Several of these tools resulted from research projects supported by the Disaster Relief Appropriations Act of 2013, which was passed by Congress in the wake of Hurricane Sandy.

Among the highlights were successful manned and unmanned aircraft missions into Atlantic hurricanes to collect data and evaluate forecast models. NOAA and NASA’s missions involving the Global Hawk, an unmanned aircraft that flies at higher altitudes and for longer periods of time than manned aircraft, allowed scientists to sample weather information off the west coast of Africa where hurricanes form, and also to investigate Hurricane Edouard’s inner core with eight crossings over the hurricane’s eye. NOAA launched a three-year project to assess the impact of data collected by the Global Hawk on forecast models and to design sampling strategies to improve model forecasts of hurricane track and intensity.

While the Global Hawk flew high above hurricanes, NOAA used the much smaller Coyote, an unmanned aircraft system released from NOAA’s hurricane hunter manned aircraft, to collect wind, temperature and other weather data in hurricane force winds at much lower altitudes during Edouard. The Coyote flew into areas of the storm that would be too dangerous for manned aircraft, sampling weather in and around the eyewall at very low altitudes. In addition, NOAA’s hurricane hunters gathered data in Hurricanes Arthur, Bertha and Cristobal, providing information to improve forecasts and to test, refine and improve forecast models. The missions were directed by research meteorologists from AOML’s Hurricane Research Division, and the NOAA Aircraft Operations Center in Tampa.

In addition, increased research and operational computing capacity planned in 2015 will facilitate future model upgrades to the GFS and HWRF to include better model physics and higher resolution predictions. These upgraded models will provide improved guidance to forecasters leading to better hurricane track and intensity predictions.

The 2015 hurricane season begins June 1 for the Atlantic Basin and central North Pacific, and on May 15 for the eastern North Pacific. NOAA will issue seasonal outlooks for all three basins in May. Learn how to prepare at hurricanes.gov/prepare and FEMA’s Ready.gov. NOAA’s mission is to understand and predict changes in the Earth’s environment, from the depths of the ocean to the surface of the sun, and to conserve and manage our coastal and marine resources.

  • 2014 Atlantic Hurricane Season 

  • NASA’s Global Hawk and the flight pattern created by AOML hurricane researchers to observer Hurricane Edouard. Image credit: NASA


  • The flight crew of the successful test launch of the Coyote Unmanned Aerial System. Image credit: NOAA

Originally Published November 2014 by Shannon Jones

0 Continue Reading →

New X/L-Band Satellite Receiving System Premieres at AOML

After months of preparation, on September 16th contractors completed the installation of a new X/L-band satellite receiving system on the AOML roof. Funded by the Disaster Relief Appropriations Act of 2013, the new system includes a radome-protected, 2.4-meter antenna and associated data processing and storage equipment. This project is designed to demonstrate the value of improved turnaround times from satellite observations to availability of processed data for operational applications.

The new system augments AOML’s existing L-band antenna, in place since 2000, and expands AOML’s ability to receive telemetry for remote monitoring of environmental conditions. It also enables AOML to create products in support of climate research and operational weather forecasts from the next generation of NOAA’s polar-orbiting satellites, including the Suomi National Polar ­orbiting Partnership (S-NPP) and Joint Polar Satellite System constellation (JPSS). Sensors received by the new antenna include the Cross-track Infrared Sounder, Advanced Technology Microwave Sounder, Visible Infrared Imager Radiometer Suite, and Ozone Mapping and Profiler Suite.

The dual nature of the new system provides backup reception for the Polar Operational Environmental Satellite (POES) and MetOp satellites, a series of three polar orbiting meteorological satellites operated by the European Organization for the Exploitation of Meteorological Satellites. POES and MetOp satellite telemetry are received by the L-band system. The use of both antennas allows AOML to expand the range of satellites and sensors received, solve previous pass-scheduling problems, and guarantee the operational distribution of the Argos Data Collection and location System in-situ data to the Argos program. Infrared and microwave sounder data from the system will be delivered to NOAA’s National Centers for Environmental Prediction for assimilation into numerical weather prediction models.

NOAA’s National Environmental Satellite, Data, and Information Service (NESDIS) chose AOML as the site for the system

because of its unique location, as well as other advantages: immediate technical support; excellent line-of-sight that ensures optimal coverage of the Caribbean, Gulf of Mexico, and U.S. east coast regions; low radio-frequency interference; close interaction with federal and university researchers; synergy with a community of local entities; and good bandwidth for rapid product dissemination. AOML also hosts the Caribbean-Gulf of Mexico regional node of NOAA’s CoastWatch program and will host NOAA’s Atlantic OceanWatch node, which expands upon the CoastWatch program by gathering satellite observations over large ocean and/or global areas.

  • First true color image received at AOML from the visible infrared imager radiometer suite sensor. September 18th 2014

  • Radome is placed over the satellite dish. Credit: NOAA/AOML

  • Radome is lifted to the AOML roof. Credit: NOAA/AOML

Originally Published September 2014 by Shannon Jones

0 Continue Reading →

Hurricane Scientists Bring a New Wave of Technology to Improve Forecasts

Scientists at NOAA’s Atlantic Oceanographic and Meteorological Laboratory are at the forefront of hurricane research to improve track and intensity forecasts. Every hurricane season they fly into storms, pour over observations and models, and consider new technological developments for how to enhance NOAA’s observing capabilities. The 2014 hurricane season will provide an opportunity to test some of the most advanced and innovative technologies, including unmanned hurricane hunter aircraft and sea gliders, which will help scientists better observe and, eventually, better predict a storm’s future activity.

The game plan: where we are and where we need to be

NOAA’s Aircraft Operations Center (AOC) maintains two P-3 Orions and a Gulfstream IV jet for hurricane observations. To collect data, NOAA’s hurricane researchers fly aboard these aircraft into and around the periphery of storms. A primary tool they use for measuring the hurricane environment is the dropsonde, a lightly weighted cylindrical tube equipped with a parachute and global positioning system technology. Dropsondes transmit their position every half second as they drift through a storm. These mini-weather stations are deployed from the belly of the aircraft and fall towards the ocean, sending data such as pressure, temperature, wind speed, wind direction, and moisture to scientists aboard the hurricane hunter aircraft.


NOAA's P-3 Orion an dG-IV hurricane hunter aircraft

NOAA’s P-3 Orion and G-IV jet. Photo credit: NOAA


While dropsondes are an excellent tool for measuring a storm’s atmospheric environment, their spatial coverage is limited. Dropsondes essentially obtain vertical profiles of a storm at discrete points. Other instruments on the aircraft measure storm properties at altitudes as great as 60,000 feet. However, NOAA’s hurricane hunter aircraft are unable to fly below 5,000 feet due to the extreme turbulence occurring between the ocean and atmosphere. This leaves a gap in the opportunity to collect potentially important data from the lower part of the storm, which may be essential to increasing the understanding of intensity change.

Congressional funding supports new unmanned aircraft

Post-Hurricane Sandy federal funding, the Disaster Relief Appropriations Act of 2013, provided NOAA with the opportunity to test new technology in hopes of better understanding and evaluating storm physics that drive intensity change. An unmanned weather drone, called the Coyote, will do just that.  The Navy originally designed the Coyote for maritime surveillance. NOAA plans to transition this unique platform into a “smart sonde” that can be used for hurricane science. During the 2014 hurricane season, the Small Unmanned Aircraft Vehicle Experiment will test the capability of the Coyote in storms, observing how well it handles severe winds and the harsh hurricane environment.


Dr. Joe Cione holds the Coyote UAS

Dr. Joe Cione of AOML’s Hurricane Research Division displays the Coyote UAV


Scientists will deploy the seven pound unmanned aircraft from the P-3 Orion in the same way as the dropsondes. However, instead of drifting downward towards the ocean surface, the Coyote will open its six-foot wingspan and fly through the storm.  It can be controlled from miles away but will typically be piloted by scientists onboard the P-3s. Its relative lightweight design requires the Coyote to fly with the wind currents, but it will be directed up, down, and sideways to navigate specific flight patterns to measure the inner core and lowest altitudes of the storm.


Hurricanes are fueled by warm ocean water, and vital information needed to better understand and predict intensity change may rest close to the sea surface where manned aircraft cannot fly and the dropsondes only pass through for a few seconds. With its ability to fly for two hours in this region, the Coyote provides the opportunity for much more complete data collection, in comparison to the traditional dropsonde.

Adding a new twist to existing technology

The traditional dropsonde itself will also receive an upgrade for the 2014 season with the addition of a sensor to measure sea surface temperature at splashdown. This additional last data point will provide a critical piece of information at the air-sea interface, the environment where energy transfer occurs and is most challenging to observe in a hurricane environment.

(image credit: NCAR)
 dropsonde

Diving into the ocean to improve hurricane forecasts

The 2014 season will also feature two sea gliders, remotely operated profiling instruments that dive below the ocean surface and then resurface to transmit observations of temperature and salinity. NOAA is testing two ocean gliders in critical hurricane regions of the Caribbean north and south of Puerto Rico. The gliders were deployed in July and will be recovered at the end of hurricane season.  The gliders will profile the upper ocean about 10 times daily, diving to a depth of 1,000 feet and collecting data as they ascend. When a sea glider breaks the surface, its data will be transmitted to AOML and made available in near-real time via the web.


Sea Gliders ready for deployment off of Puerto Rico
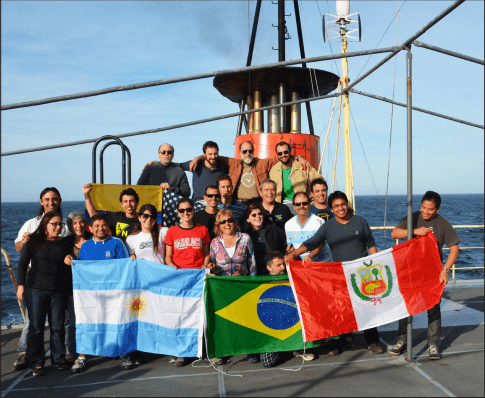
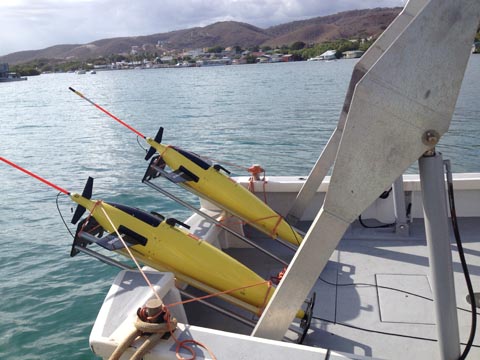
Two gliders ready for deployment from the R/V Sultana,

off the coast of Puerto Rico (credit: NOAA/AOML)


In addition to these new technologies, the Disaster Relief Appropriations Act of 2013 also provided funding to assess the impact of data from these and other instruments in hurricane forecast models. AOML will make use of its Observing System Simulation Experiment expertise to evaluate how such ocean observations can best improve hurricane forecasts of track and intensity change.


The Hurricane Research Division is one of AOML’s three scientific research divisions. Scientists with HRD, and its precursors, have been flying into hurricanes for almost 60 years and regularly collaborate with other federal, university, and international  partners to leverage that expertise to advance hurricane science and forecasting globally. Follow the latest HRD activities during this research season on Twitter or by visiting the division website.

Originally Published August 2014 by Shannon Jones


0 Continue Reading →