Skip to Content

Blog Archives

Indian Ocean Plays Key Role in Global Warming Hiatus

The earth is warming, but temperatures in the atmosphere and at the sea surface that steadily rose in the last half-century have leveled off and slowed in the past decade, causing the appearance of an imbalance in Earth’s heat budget. Scientists are looking into the deep ocean to determine where this additional heat energy could be stored, and recently traced a pathway that leads to the Indian Ocean.

In a study published May 18 in Nature Geoscience, oceanographers from the University of Miami’s Rosenstiel School, Cooperative Institute for Marine and Atmospheric Studies (UM/CIMAS), NOAA and their colleagues identified a key mechanism that explains the apparent contradictions associated with the recent global warming hiatus. Building upon previous studies that suggest enhanced heat uptake in the tropical Pacific Ocean as the major source of the imbalance, the new study tracked this excess heat from the Pacific to the Indian Ocean via Indonesian pathways.

Since the 1950s, global average surface air temperatures have increased steadily, with the warming attributed to greenhouse gases originating from human activities. Since the start of the 21st century however, global surface warming has almost stalled. This contradicts with the amount of net radiation entering Earth at the top of the atmosphere, which continues to suggest an increasingly warming planet. The slowdown of surface warming was the focus of a series of studies that sought to identify and track the causes of this process.

Researchers initially pegged the tropical Pacific as the major source of heat uptake, theorizing that the basin was storing a large portion of the global heat imbalance over the last decade, thereby causing the atmosphere to warm less. Natural climate variability processes such as El Niño/Southern Oscillation (ENSO), a cycle of warm and cold sea surface temperature in the tropical Pacific Ocean, drive wind patterns and ocean currents across the region. Since the turn of the century, the cold phase of ENSO, known as La Niña, has persisted, increasing the uptake of warm surface waters in the subtropics. This process and others have enhanced the uptake of heat from the atmosphere to the top 2,000 ~ 3,000 feet of the ocean.

While uptake in the Pacific as a result of La Niña-like conditions may have answered the initial question regarding the heat missing from the atmosphere, findings from the recent study indicate that Pacific heat has been slowly decreasing and that the excess heat has been transported elsewhere.

“When I first saw from the data that Pacific heat was going down, I was very curious and puzzled,” says the study’s lead author Dr. Sang-Ki Lee, a climate researcher with UM/CIMAS and NOAA’s Atlantic Oceanographic and Meteorological Laboratory.

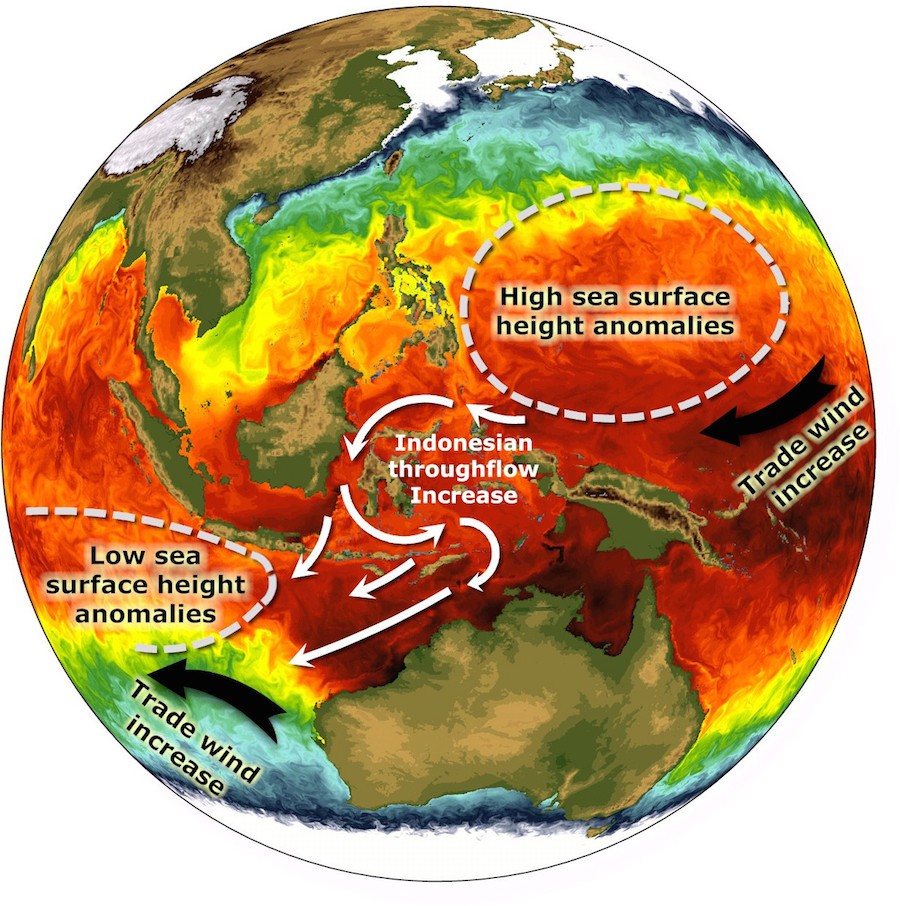
Results from the study suggest that the excess heat is being stored in the Indian Ocean, which has seen an unprecedented rise in heat over the past decade. Researchers studied observations going back to 1950 and noticed that the Indian Ocean heat uptake stayed relatively low until 2003 or so. From that point forward, observations indicated that heat began to build in the Indian Ocean and there was no evidence to support that the source was from the atmosphere. By running simulations from a global ocean-sea ice model to track the pathway of heat, researchers found that the heat originally stored in the Pacific was transported by a strong ocean current, known as the Indonesian Throughflow, and ended up in the Indian Ocean. The heat flux into the Indian Ocean via the Indonesian pathway means that the Indian Ocean is increasingly important in modulating global climate variability and is now home to 70 percent of all heat taken up by global oceans during the past decade.

The study helps resolve an important debate regarding the warming hiatus. Scientists theorize the Pacific played a role in the warming hiatus, yet all observations indicated that total heat in the Pacific basin had not increased as expected. This study reveals that the Pacific was an intermediary in the heat storage process, but not the final destination, explaining the lack of change in Pacific heat.

Lee has several thoughts about future effects of this warm deep ocean water. In its current location, Lee said it’s possible that the warm water in the Indian Ocean could affect the Indian Monsoon, one of the most important climate patterns in the world that affects more than 1 billion people. What it means for future El Niño cycles is not immediately clear. However, Lee noted that the warm water in the western Pacific, which provides the energy needed to produce intense El Niño events, has been partially discharged into the Indian Ocean, suggesting weaker El Niño events in the near future.  Lee also indicates that the heat content is likely to continue moving with global ocean currents and may find its way into the Atlantic basin in the coming decades.

“If this warm blob of water in upper Indian Ocean is transported all the way to North Atlantic, that could affect the melting of Arctic sea ice,” Lee said. “That can also increase hurricane activity and influence the effects of drought in the U.S, but future studies are required to validate these hypotheses.”


Originally Published in May 2015 by Edward Pritchard
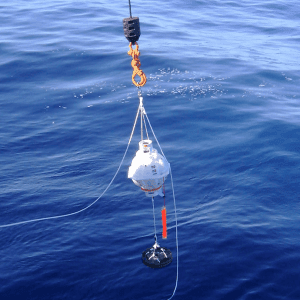
0 Continue Reading →

Meridional Overturning Circulation: Following the Heat

Deployment of a PIES mooring in the South Atlantic. Photo credit: NOAA/AOML

If you want to understand Earth’s climate and how it changes from year-to-year and decade-to-decade, look to the oceans, and follow the heat. The major driver in the redistribution of heat around the globe in the ocean-climate system is Meridional Overturning Circulation, or MOC. The MOC is a vertical circulation pattern that exchanges surface and deep waters via poleward movement of surface waters. As an example, the well known Gulf Stream on the eastern seaboard of North America carries warm water northward to the Greenland and Norwegian Seas, where it cools and sinks.

Scientists with AOML’s Physical Oceanography Division joined with partners from Argentina and Brazil in October to study the MOC at 34.5°S in the South Atlantic. On board the Argentine research vessel ARA Puerto Deseado, researchers united for the ninth joint cruise undertaken in support of the NOAA-funded Southwest Atlantic MOC (SAM) project since March 2009. Participants included researchers from the Universidade de Buenos Aires, the Servicio de Hidrografía Naval, the Instituto Nacional de Investigación y Desarrollo Pesquero, the Universidade Federal do Rio Grande, and the Universidade de Sao Paulo, as well as NOAA-AOML.

The MOC sinks at high latitudes and upwells elsewhere. Its variability is linked in numerical models to significant changes in precipitation patterns, surface air temperatures, and hurricane intensity over large portions of the Earth. NOAA-AOML serves in a leading role with its partners to collect observations of the South Atlantic portion of the global MOC system to gain a more complete understanding of its complex nature. A complete trans-basin instrument array to measure the MOC at 34.5°S is in the process of deployment, and NOAA instruments near the western boundary are the cornerstone of the full array.

On this fall 2014 cruise, scientists used ship-based instruments to acoustically download data from four pressure-equipped inverted echo sounder (PIES) moorings in the SAM array, as well as two similar Brazilian instruments. These instruments send sound pulses from their position near the ocean floor to the sea surface and listen for the return of the reflected sound waves. The round-trip acoustic travel time measurements are then combined with historical hydrographic data to obtain daily estimates of the temperature, salinity, and density for the full water column above the mooring. Meanwhile, the pressure gauges provide information on the variability of deep-water flows. The combination of data sets from the PIES moorings provides long-term observations of the shallow and deep western boundary currents at 34.5°S, key components in the MOC system.

The existing array is scheduled to continue through at least 2016, with annual or semi-annual cruises planned to collect new hydrographic information and acoustically download data from the array. NOAA’s contribution to this effort is funded by the Climate Program Office/Climate Observations Division and by AOML.

Originally Published in November 2014 by Shannon Jones

0 Continue Reading →

NOAA’s Array of Drifting Ocean Buoys

Global Drifter Program

Drifting buoys are a primary tool used by the oceanographic community to measure ocean surface circulation at unprecedented resolution. A drifter is composed of a surface float, which includes a transmitter to relay data via satellite, and a thermometer that reads temperature a few centimeters below the air-sea interface. The surface float is tethered to a holey sock drogue (a.k.a. “sea anchor”), centered at 15 m depth. The drifter follows the ocean surface current flow integrated over the drogue depth.


A drifting buoy being deployed from the Bark Europa off South Africa (credit: NOAA/AOML)

A drifting buoy being deployed from the Bark Europa off South Africa (credit: NOAA/AOML).


/pix/Keynotes/drifter_group.jpg
Schematic of a drifting buoy.(credit: NOAA/AOML)


There are currently over a thousand drifters circulating in the world ocean measuring sea surface temperature and other data as ocean currents carry them along. These currents carry heat from place to place around the ocean basins, which affects regional climates. Drifter velocities are derived from finite differences of their position fixes. These velocities and their concurrent sea surface temperature measurements are archived at AOML’s Drifting Buoy Data Assembly Center where the data are quality controlled and interpolated to quarter-day intervals. While satellite technology makes it possible to obtain sea surface temperature measurements from space, drifters are needed to ensure the measurements are accurate. Without drifter observations to correct satellite measurements, dust and other aerosols in the atmosphere can cause errors.


Approximately half of the drifters also measure air pressure, and send the data to weather centers for improved marine forecasts.  A smaller number of drifters have been deployed to measure other properties such as surface salinity and heat content in the upper 150m of the ocean.  Drifters have been air deployed in the paths of hurricanes and typhoons to measure how the ocean and atmosphere interact during storm passage and to improve intensity forecasting.


Although NOAA’s Global Drifter Program deploys, monitors, and collects data from drifting buoys globally, the program is managed by researchers at AOML and the Scripps Institution of Oceanography. “The goal of NOAA’s Global Drifter Program is to maintain a global array of satellite-tracked drifters and to provide valuable climate and weather data to the forecasting and research community,” said Dr. Rick Lumpkin, Global Drifter Program Principal Investigator at AOML. “These drifters also provide an excellent oppor­tunity for children to learn more about the ocean as they track currents and eddies.”

Students deploy an adopted drifter for Earth Day 2013
Students deploy an adopted drifter for Earth Day 2013. (credit: NOAA/AOML) 


Each drifter is part of a global ocean array that can be followed online. AOML’s component of the Global Drifter Program consists of the Drifter Operations Center (DOC) and the Drifter Data Assembly Center (DAC). The DOC manages global drifter deployments, using volunteer ships of the Ship Of Opportunity Program, research ships and aircraft. The DAC verifies that the drifters are operational, distributes the data to meteorological services, assembles, quality controls and makes the data available on the web, and offers drifter-derived products.

 Map of drifter trajectories in the North AtlanticMap of drifter trajectories in the North Atlantic. (credit: NOAA/AOML)


Using more than 30 years of observations obtained from satellite-tracked surface drifting buoys, NOAA scientists derived a global climatology of seasonally varying ocean surface currents at one-half degree resolution. This data set can be used to better understand how the ocean transports properties such as heat, salt, and passive tracers, and as a reference for studying changes in ocean currents over time.

Congratulations to Rick Lumpkin & Mayra Pazos, awarded as OAR Employees of the Year!

Rick Lumpkin and Mayra Pazos of PhOD won the 2013 OAR Employee of the Year Award.  The award was given to recognize the Global Drifter Program’s federal employees, Rick Lumpkin and Mayra Pazos, for their efforts to improve the quality of the drifter data by developing a new methodology to evaluate when drifters have lost their drogues.  This reevaluation required manual examination of time series from over 14,000 drifters, to determine cases in which the drogue lost time was misdiagnosed, and to reassess those times.  The reevaluation was initiated in April 2012 and concluded in April 2013, and publicly-available metadata files containing drogue off dates were revised 16 times during that period to distribute the most recent results. Published results by Lumpkin et al. (2013) indicate that the revised data set is significantly improved, with spurious low-frequency current variations in places like the Southern Ocean now no longer present.  Research papers published by Rick Lumpkin while addressing the problem have been cited in more than 28 peer-reviewed publications so far.


The Drifter team at AOML

The drifter team at AOML (credit: NOAA/AOML) 
 

2014 Hurricane Season Global Drifter Updates

Hurricane Ana approaches Hawaii'i and crosses over NOAA's array of drifting Ocean Buoys

Hurricane Ana approaches Hawai’i while passing over NOAA’s array of Ocean Buoys. (credit: NOAA/AOML)


On Friday, October 17, as Tropical Storm Ana strengthened and moved towards the Hawaiian Islands, Air Force Hurricane Hunters deployed 10 drifting buoys in her path. Ana was forecasted to become a hurricane as it passed over the drifter array on her way to the main Hawaiian Islands.


Data from 9 of the drifters was successfully retrieved, providing wind speed and direction, barometric pressure, ocean temperatures to 150m depth, and ocean currents in the mixed layer.  The data from these drifters will reveal the strength of the storm, the structure of its oceanic wake, and will help improve hurricane intensity forecasting models with an active ocean component. NOAA’s Global Drifter Program coordinated these deployments.

Originally Published August 2014 by Shannon Jones

0 Continue Reading →