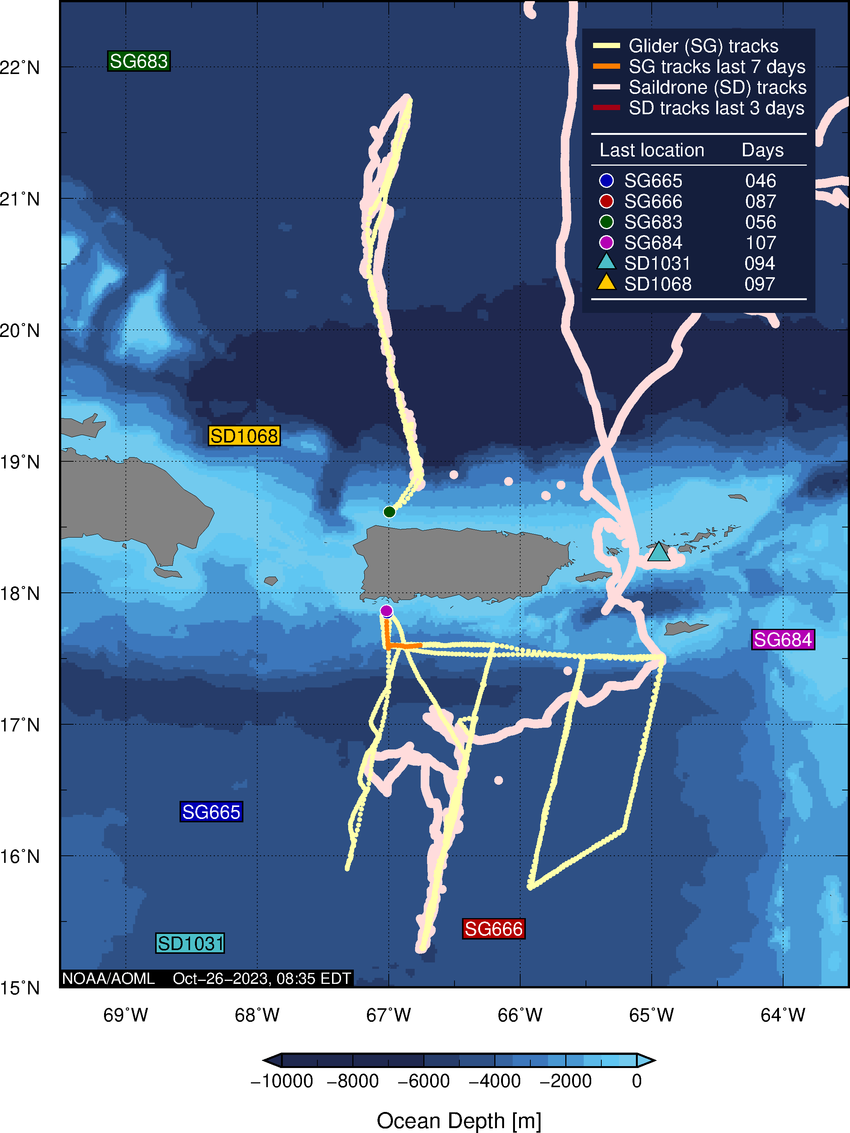
This webpage provides near-real-time location of gliders and saildrones, and plots with time series of saildrone observations and glider temperature and salinity sections.

You may select from the tabs below the ID of the saildrone to visualize their observations. In the time series below, light colors show the values of the instantaneous
observations at the original sensor temporal resolution, while the dark color lines are a 12h moving average of these observations.
| SD1031 | SD1068 |