NOAA RTOFs vs Gliders Near-Real-Time Evaluation
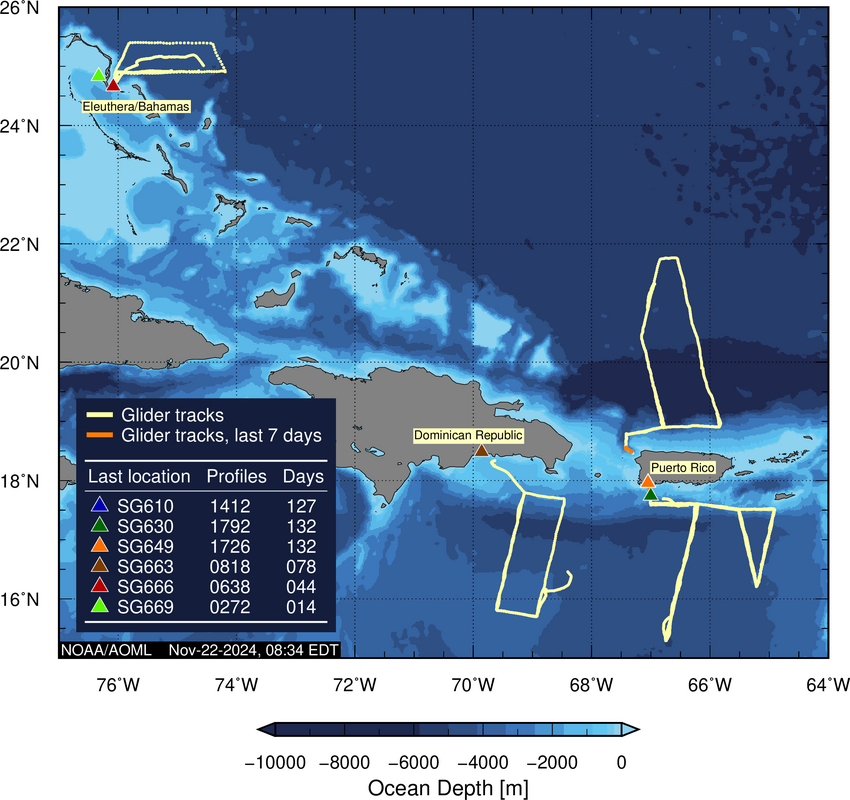
This page provides to near-real-time comparisons between underwater glider data, and the NOAA RTOFs temperature and salinity fields used in operational coupled forecasts. RTOFs temperature and salinity fields are retrieved for the location and time of glider observations, and observed glider profiles are used to compute daily averages, vertically averaged for model layers. Plots are updated daily, and include a delay of approximately 24 hours.
The products on this page are not operationally maintained and there may be times when they are not updated or available.