Methodology & Results
For general background information on the entire AOML Contribution to the assessment of the State of the Oceans, see the State of the Oceans Background & FAQ
For broader information on AOML Meridional Atlantic Heat Transport estimations, see the Heat Transport Background & FAQ
Methodology Used for North Atlantic:
Uncertainty Estimates:
Results:
The methodology used to obtain the baroclinic component of the heat transport from the XBT data collected along AX7 is as follows: Salinity (S) is estimated for each XBT profile by using the World Ocean Atlas 2001 (WOA01) gridded annual climatology (Stephens et al. 2002) by inferring S for each T, assuming a constant T vs S relationship that is well represented by the closest WOA01 grid point to each XBT location. In order to obtain the heat transport across the section, the total mass transport must be zero (i.e. mass must be conserved). The XBT probes samples the ocean only up to about 850m, hence the data are extended to the bottom using the WOA01 gridded climatology bathymetry by interpolating the data to the location of each XBT to generate an annual mean climatology for the deep ocean. The bottom is determined to be the depth at the location of the XBT from the Smith and Sandwell (1997) 2 minute data base of bathymetry.
Geostrophic velocities are determined using the dynamic method where a level of no motion was chosen at a depth just below the northward flowing Antarctic Intermediate Water at σ0 = 27.4 kg m-3 (σ0 defined as potential density relative to the surface) and z = 2000 m to compare with previous results. The Florida Current transport (see AOML site) is prescribed to be 32 Sv, the mean value of more than two decades of observations there (Baringer and Larsen 2001). Ekman transports are determined using Hellerman and Rosenstein climatological annual mean winds by interpolating to the location of the XBT observation. Transports are computed in layers and summed for the entire water column. A simple constant velocity for each section is then applied uniformly at the reference level so that the net mass transport across the section was zero. Typically, values of this velocity range from 10-4 to 10-6 m s-1.
Possible uncertainty in the findings can result from the assumptions applied, including: the simple mass balance geostrophic method, the uncertainty in salinity assigned to each temperature observation, the representativeness of Levitus data below 800 m, and the variable latitudes that each XBT section crosses the Atlantic. Sensitivity to these factors and others such as the specific wind climatology used and its inherent uncertainty are discussed in the Uncertainty Estimates page.
Presently, we take the estimates from Hall and Bryden and others of 0.2 PW to be our uncertainty. However, we believe this to be an underestimate of the true uncertainty.
For further information on ongoing research in uncertainty estimates for Meridional Heat Transport, please refer to the Uncertainty Estimates page...
Ekman fluxes from different wind products
The total Ekman heat flux is define as the difference between the Ekman temperature transport (in the Ekman layer) and the section average temperature times the Ekman mass flux (so that the Ekman transport is mass-balanced).The following figure shown Ekman heat flux between 24oN and 36oN using Levitus temperature and NCEP winds.
|
a) The Ekman flux is determined from the Hellerman annual mean climatology, the ECMWF monthly values and the NCEP monthly values. The EKman fluxes differ by less that 0.03 PW.
b) Differences between the Ekman fluxes above. The ECMWF fluxes are typically lower that the Hellerman or NCEP fluxes.
c) The total heat transport using the three different Ekman flux estimates.
The geostrophic heat transport is determined from the XBT section
(see Baringer and Garzoli, 2007).
All calculation theme produced these results are made by Sandra Bringas. For more
information, contact sandra.bringas@noaa.gov
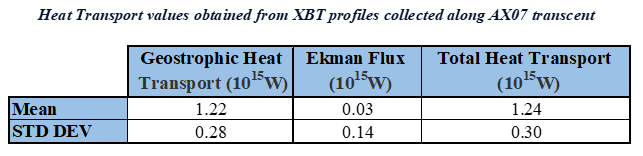
The table below shows the Geostrophic component, Ekman component, and Total Meridional Heat Transport along the AX07 XBT transect, from all cruises since 1994. Here is a complete list of all results obtained from all AX07 cruises and used to compute the totals in the table below. The calculations were done using NCEP daily wind.