Western Hemisphere
SST Area Index Time Series
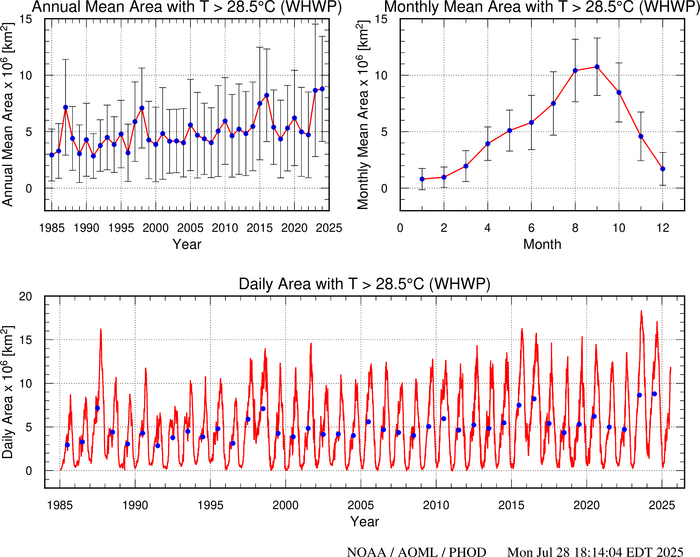
The figures at the top show the annual and monthly warm pool area index, defined as the area inside the 28.5°C isotherm at the sea surface, in the Western Hemisphere Warm Pool (WHWP) region. The lower plot is the area index time series in the region from January 1985 to the present, with one observation every approximately two days.
The upper figures are updated once a year. The lower figure is updated once a month to include the most recent data. The vertical bars are one standard deviation.
Please refer to this link for data, products and results aknowledgement and distribution.