Western Hemisphere
Mean SH Index Time Series
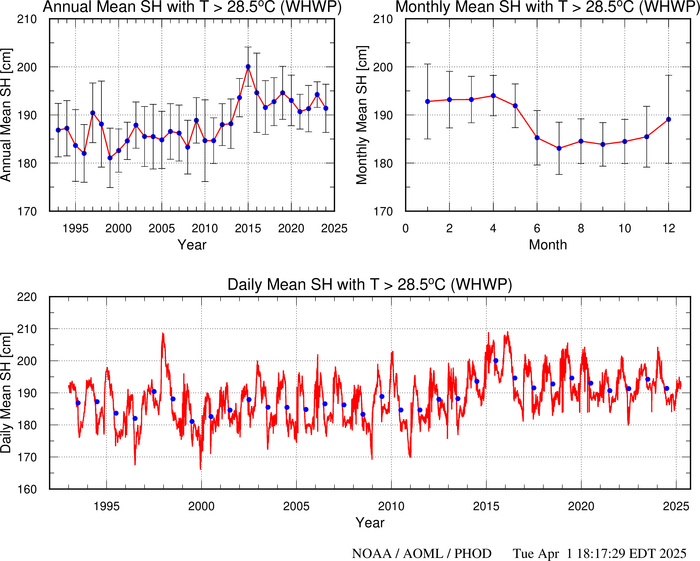
The figures at the top show the annual and monthly mean sea height inside the 28.5°C isotherm in the Western Hemisphere Warm Pool (WHWP) region. The lower plot is the mean sea height inside the 28.5°C isotherm time series in the region from October 1992 to the present, with one observation every approximately seven days.
The upper figures are updated once a year. The lower figure is updated once a month to include the most recent data. The vertical bars are one standard deviation.
Please refer to this link for data, products and results aknowledgement and distribution.