Gulf of America
Sea Height Residuals (SHR)
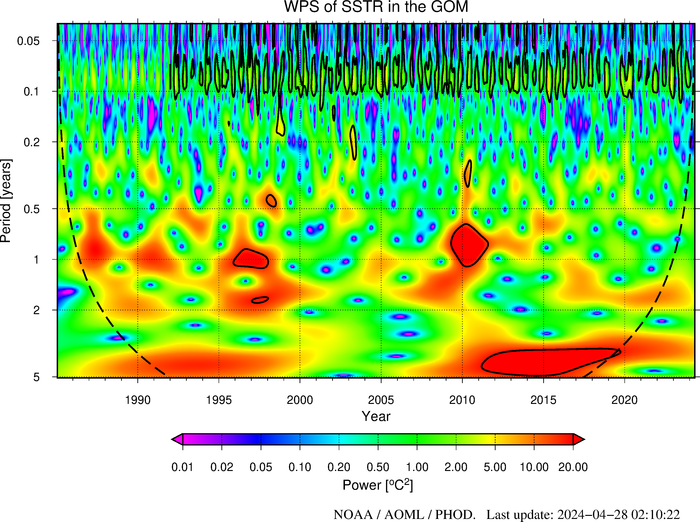
Wavelet Analysis of the Sea Surface Temperature Residuals (SSTR)
The figure below shows the Wavelet Power Spectrum (WPS) of the SSTR in the GOA. The solid black contour represent the peak-based significance levels, computed at 95%. The dashed curve indicates the cone of influence (COI). Edge effects become important in regions of the wavelet spectrum below the COI.
This figure is updated once a month to include the most recent data.

Please refer to this link for data, products and results aknowledgement and distribution.