Gulf of America
SST Residuals
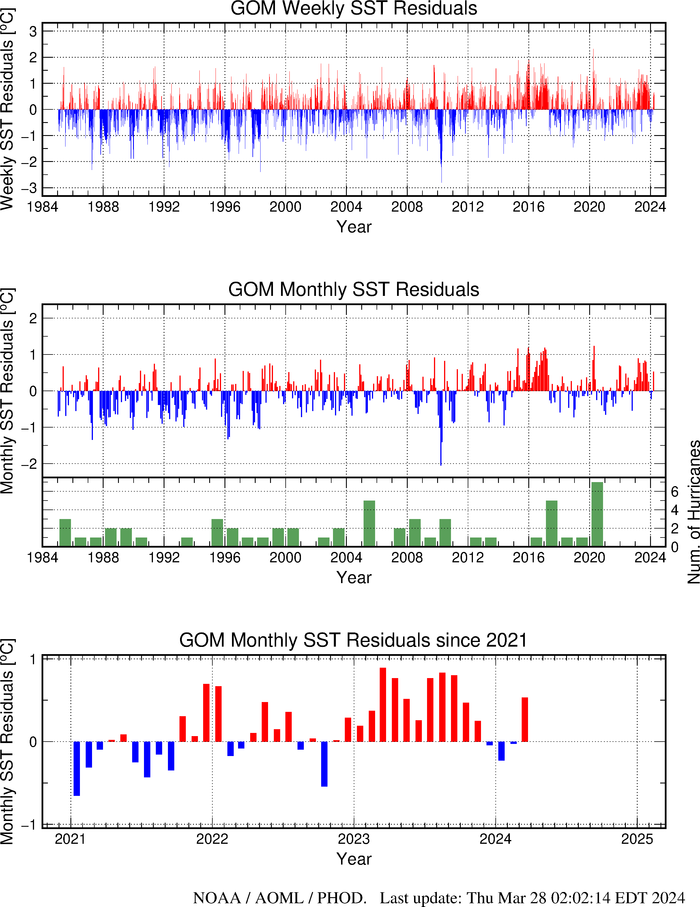
The figures below show the sea surface temperature (SST) weekly and monthly residuals (upper and middle plots, respectively) in the Gulf of America. The details of the monthly residuals for the last 3 to 4 years are shown in the lower panel. The number of tropical storms that developed into hurricanes inside this region is also plotted in the middle pannel.
The monthly residuals for each month is the difference between the mean SST for that specific month and the mean SST value for that month since January, 1985.
These time series are updated monthly.
Please refer to this link for data, products and results aknowledgement and distribution.