Gulf of America
SHA and SHR
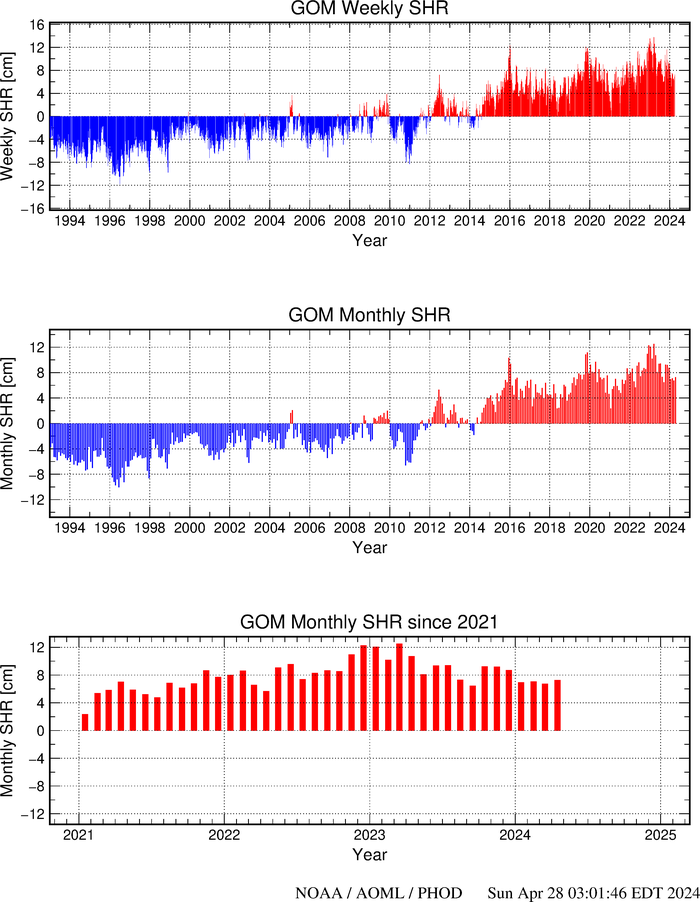
Sea Height Residuals (SHR)
The figures below show the weekly and monthly SHR (upper and middle plots, respectively) in the Gulf of America. The details of the monthly SHR for the last 3 to 4 years are shown in the lower panel. The monthly SHR for each month is the difference between the mean SHA for that specific month and the mean SHA value for that month since October 1992.
These time series are updated monthly.
Please refer to this link for data, products and results aknowledgement and distribution.