XBT Analysis - East Australian Current
East Australian Current location
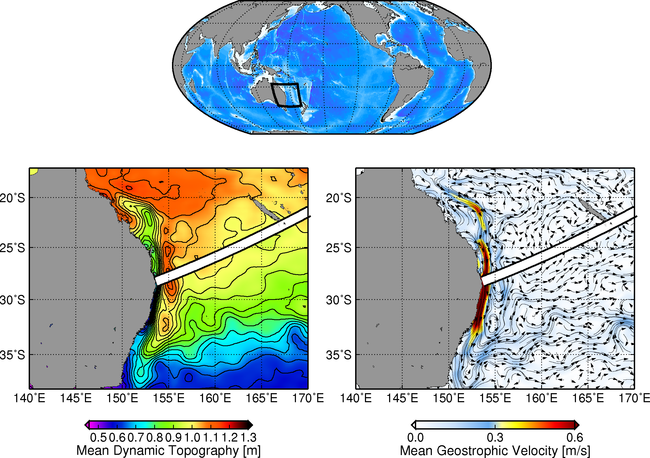
Location of PX30, which is used to compute the East Australian Current velocity and transports at 30°S, overlaid on the (left) Mean Dynamic Topography, and (right) Mean Geostrophic Velocity from the MDT_CNES-CLS09 climatology.
Area Sampling
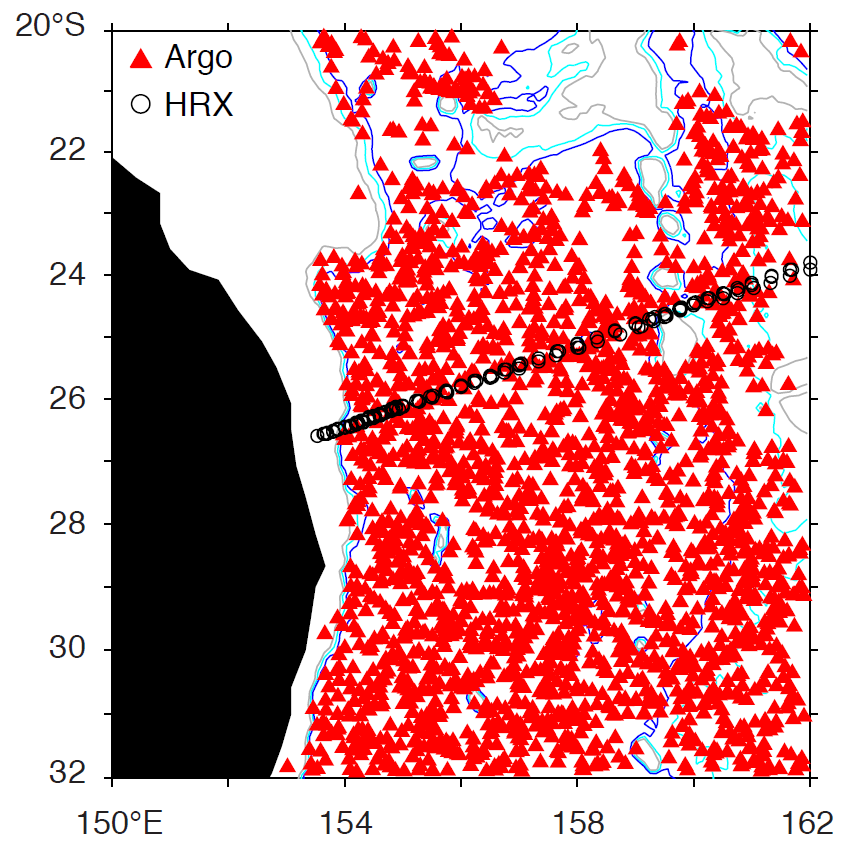
Location of Argo profiles (red triangles) during 2004-2012 and of XBT profiles along PX30 on 2010.
Even though Argo accumulates many profiles in WBC regions, High Density XBT transects (HRX) obtain observations at much higher spatial resolution along selected lines. Also, the sampling along HRX extends farther shoreward than Argo (in strong EAC shear).
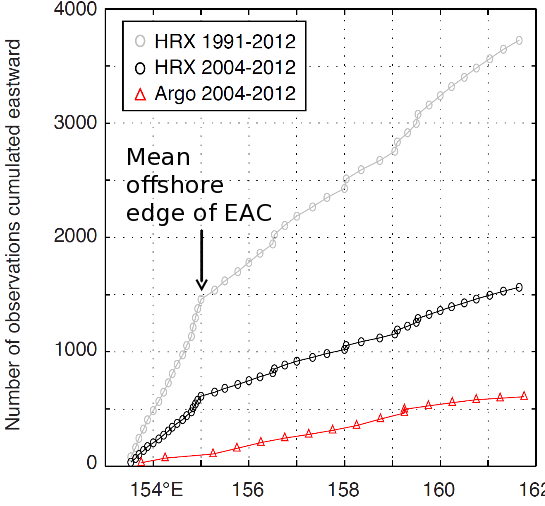
Gray line - number of XBT profiles along PX30 during 1991-2012. Black line - number of XBT profiles along PX30 during the Argo period (2004-2012). Red line - number of Argo profiles during 2004-2012 within 1.5 latitudinal degrees from PX30.
Between the shelf break and the offshore edge of the EAC at 155°E, there are about 700 XBT profiles (from 34 transects, 2004-2012), compared with about 100 Argo profiles and trajectories.
East Australian Current velocity accross PX30
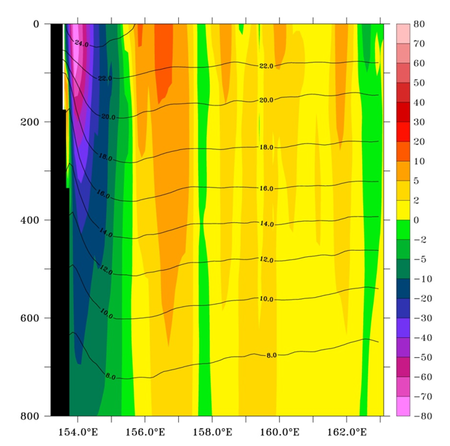
Absolute geostrophic velocity accross PX30. The southward flow associated with the EAC is observed to the west of 154°E.
Transports across PX30
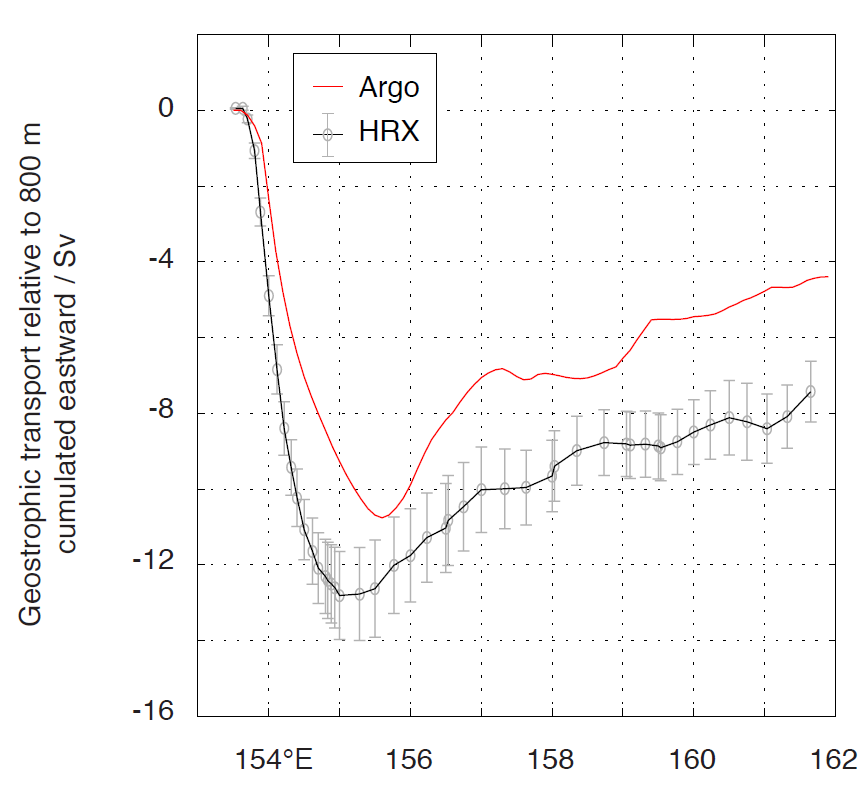
Cumulative transport between 0-800 m from Argo (Red line) and XBTs (Black line). The reference level at 800 m is used for this computation.
For estimating geostrophic shear across the given track in the upper 800 m, HRX transects have less random error and sampling/coverage bias (from along-current averaging and near-shore data) than Argo.
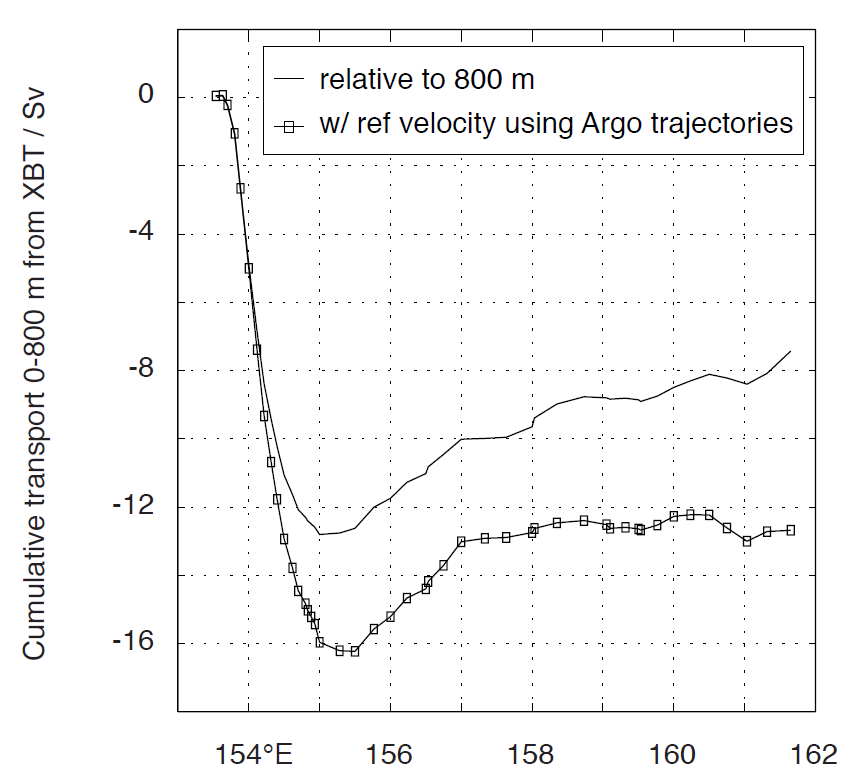
Adjusted cumulative transport from XBTs.
Then, (not shown) altimetric sea surface height is used (i) to adjust deep Argo shear (800-2000 m) to the same mean time period as HRX, (ii) to estimate time variability in transport (correct for temporal aliasing of HRX data) and reduce the error of the mean transport.
The XBT data along PX30 can be obtained here>>
Acknowledgments
The Mean Dynamic Topography and Mean Geostrophic Velocity fields are from the MDT_CNES-CLS09 climatology produced by CLS Space Oceanography Division and distributed by AVISO, with support from CNES.