[back to map]
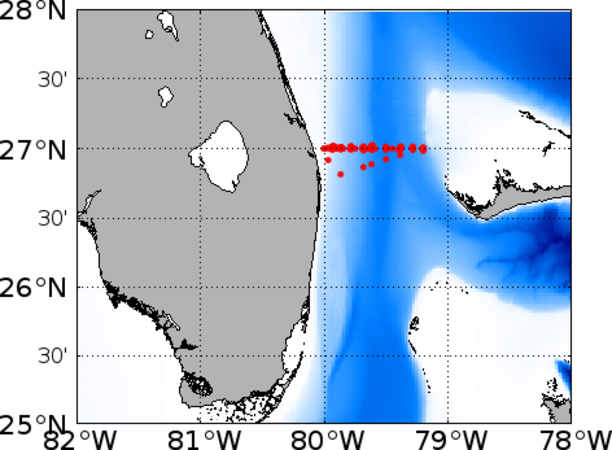
XBT deployments along AX_WBTS
top
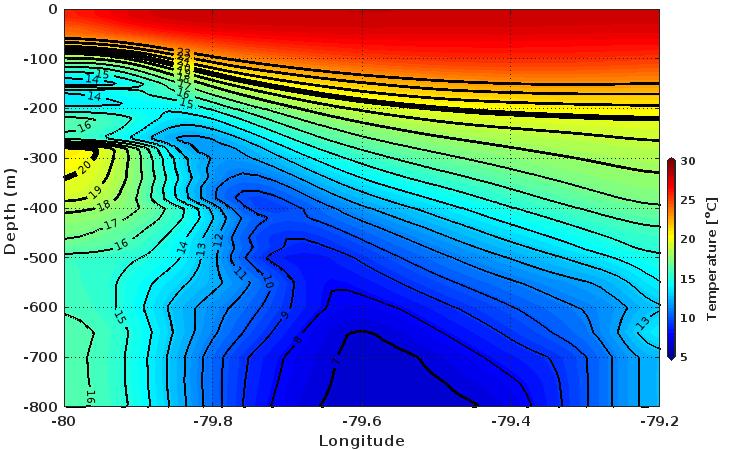
The figure below shows the mean temperature section along AX_WBTS.
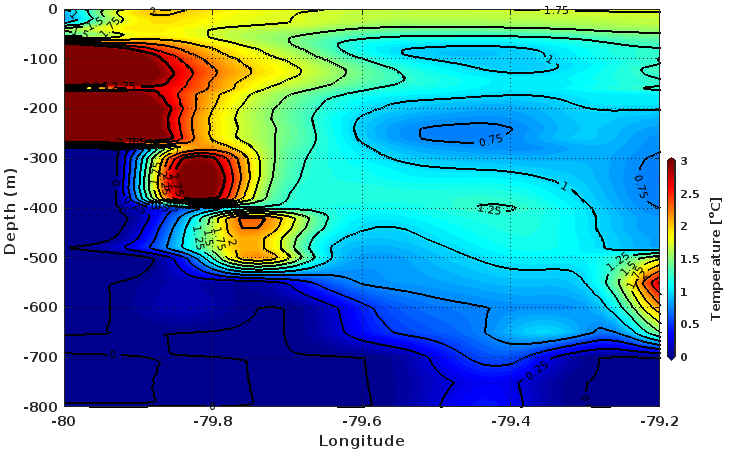
The figure below shows the standard deviation of the mean temperature section along AX_WBTS.
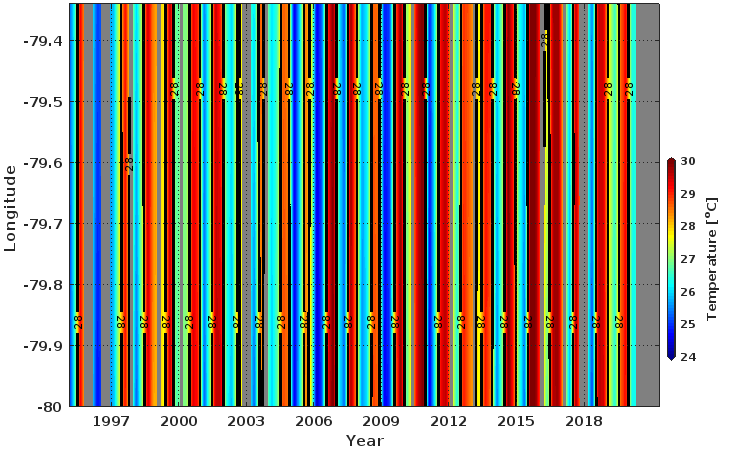
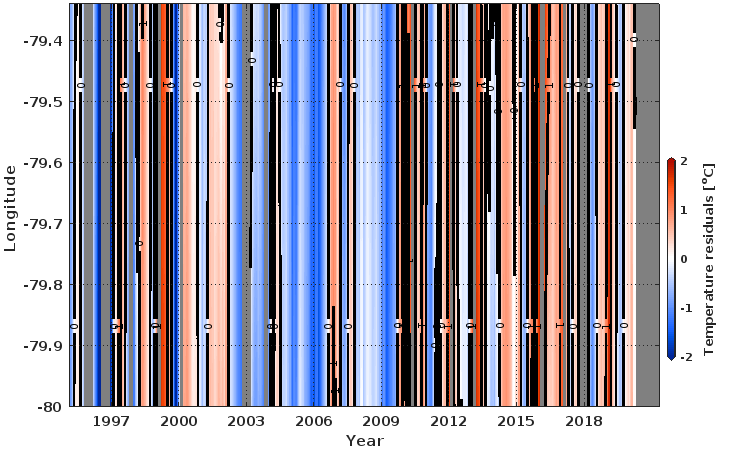
The diagrams below show the temporal and spatial distribution of temperature along AX_WBTS at selected depths.
*residuals are obtained by substracting the seasonal cycle