[back to map]
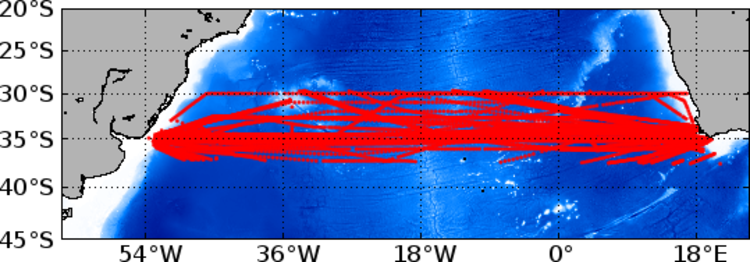
XBT deployments along AX18
top
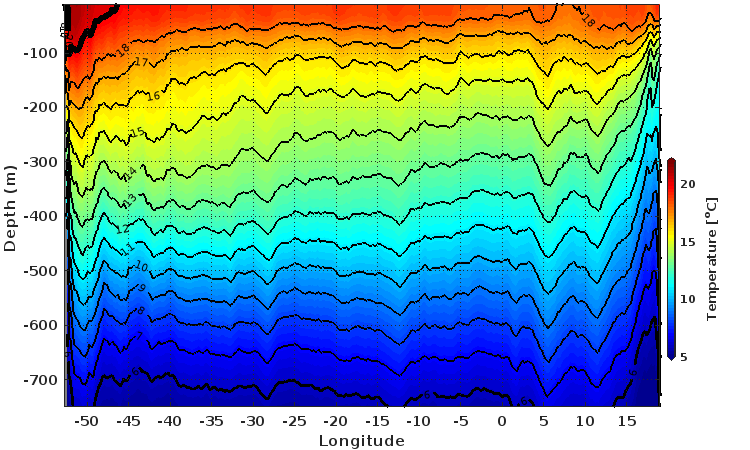
The figure below shows the mean temperature section along AX18.
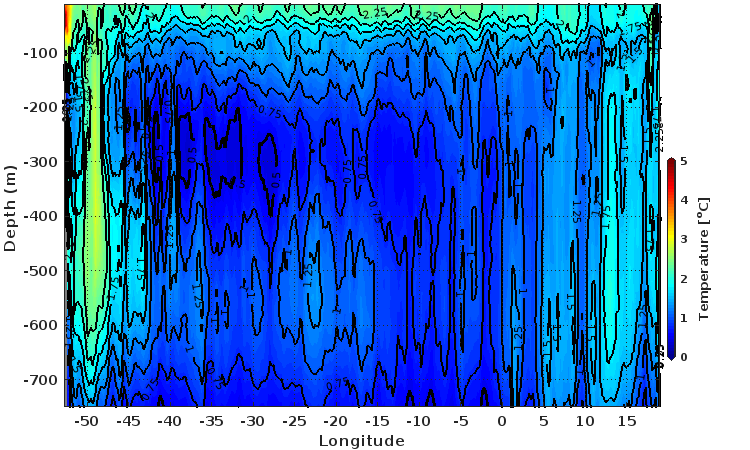
The figure below shows the standard deviation of the mean temperature section along AX18.
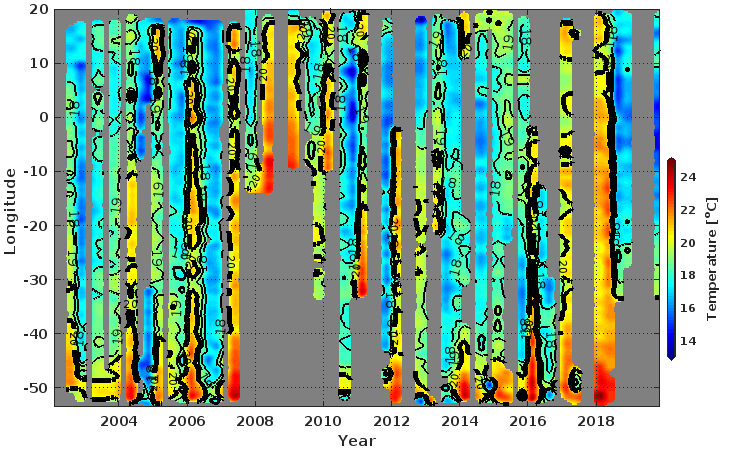
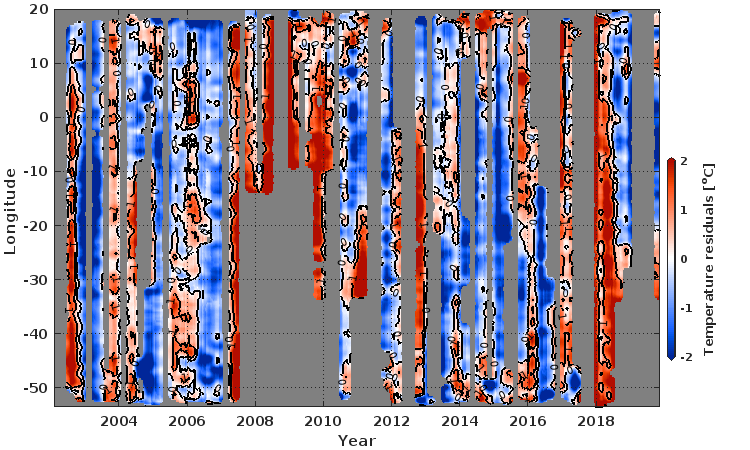
The diagrams below show the temporal and spatial distribution of temperature along AX18 at selected depths.
*residuals are obtained by substracting the seasonal cycle