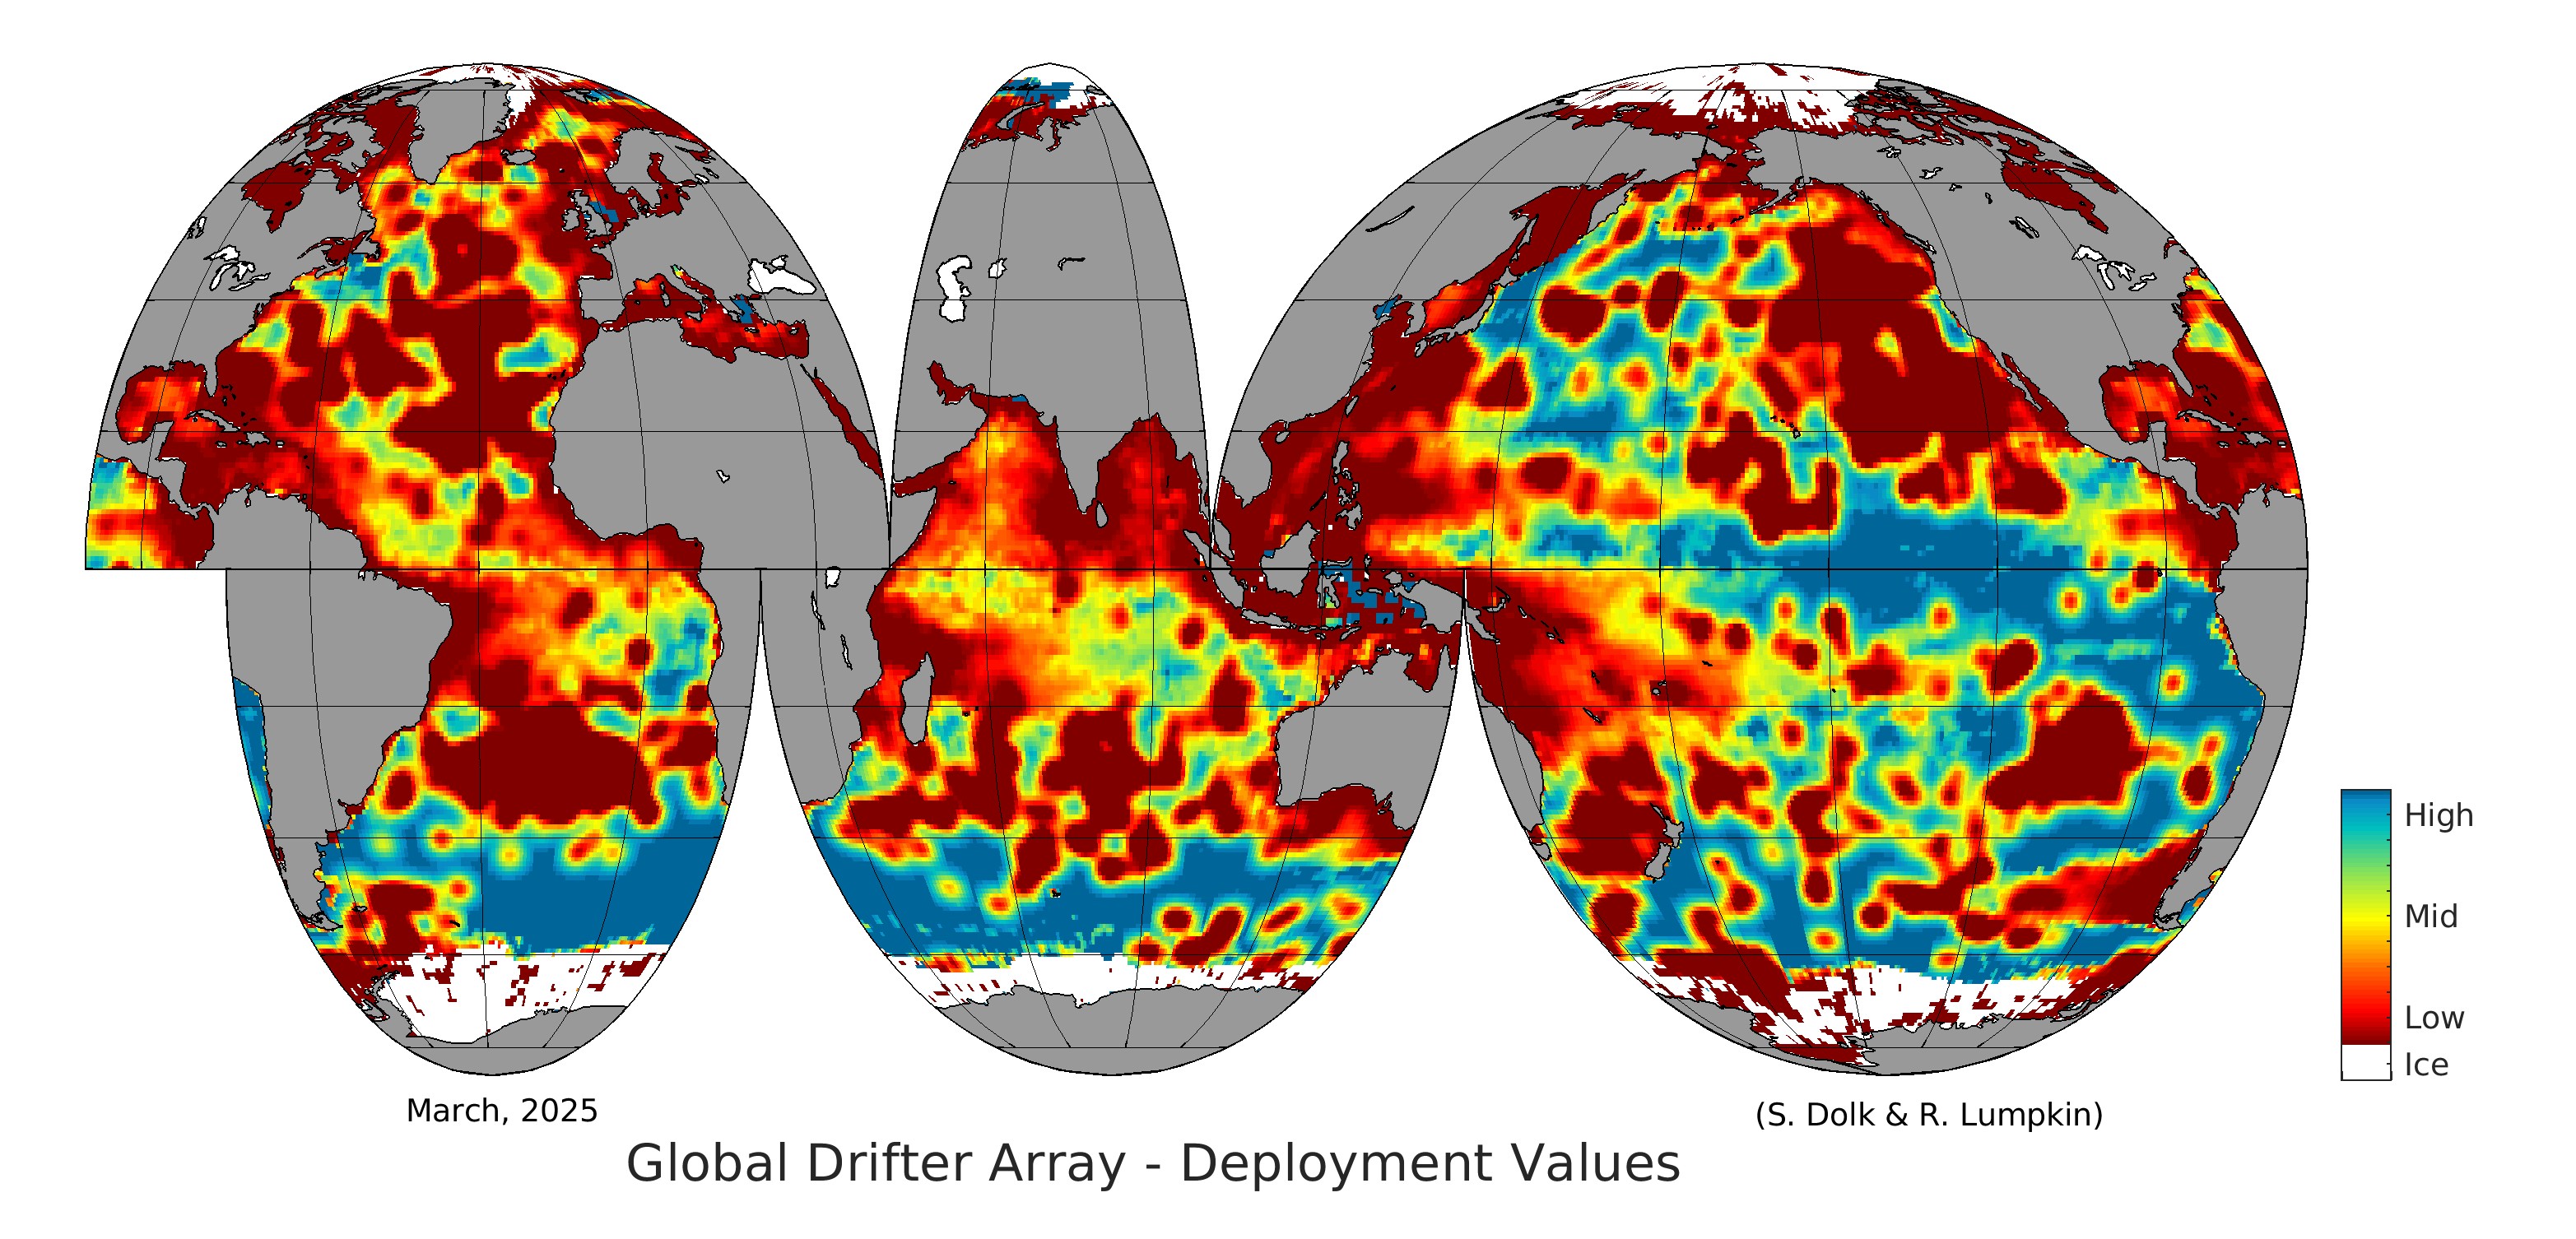
To determine where valuable deployment locations exist, please reference the global map above (or one of the regional maps found in the tab below). High value deployments are associated with blue regions within the map, while less desirable deployment locations are found in red.
Deployment values are determined by identifying key factors that affect drifter lifetimes. For example, less value is placed on areas where drifters have been observed to die quickly. Other factors are based on the anticipated configuration and value of observations currently collected by the global drifter array. Such factors include the number of operational sensors on each drifter currently in the array, drogue (sea anchor) presence, drifter age, and projected drifter deployments. After evaluating these factors and projecting the drifter positions forward in time using monthly mean currents, deployment values are assigned, identifying where drifters are needed (areas in blue!). Deploying drifters in high value locations will maximize drifter data coverage, reduce deployment redundancy, and increase drifter lifetimes.
To download a file with drifter deployment values by latitude and longitude, click here
Note: NaN values have been replaced with 999, while closed basis, areas shallower than 25m, and ice-covered regions are designated with a zero value.