High Resolution Satellite-Derived Ocean Color (Chlorophyll-a) Products

Why are they helpful?

Meassure by satellite, maps of ocean color do not represent the true color of the ocean but rather the amount of chlorophyll present, outlining differences in chlorophyll across the sea surface. Concentrations of chlorophyll that are biologically driven, vary between shelf waters of the Gulf of Mexico and the Loop Current. As a result, these differences help to define Gulf of Mexico circulation features of interest to decision makers, managers, and scientists.

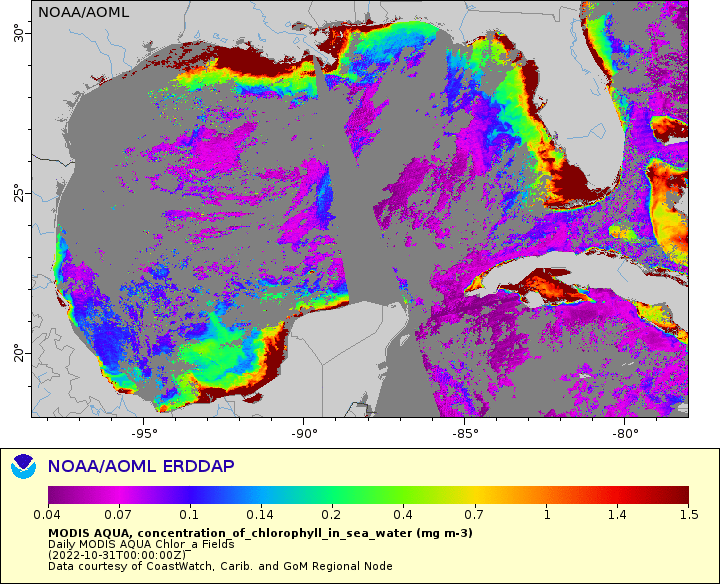
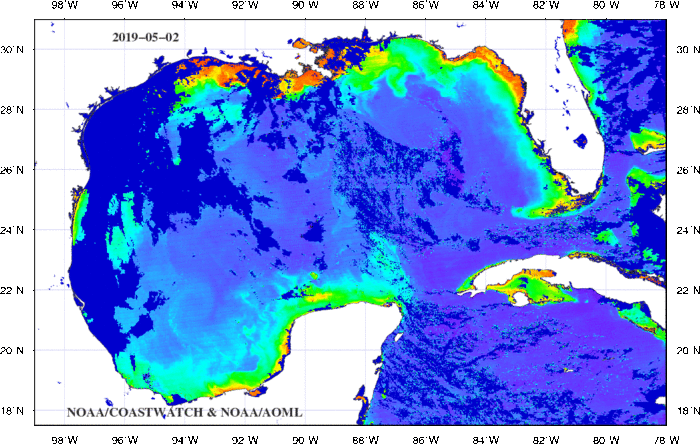
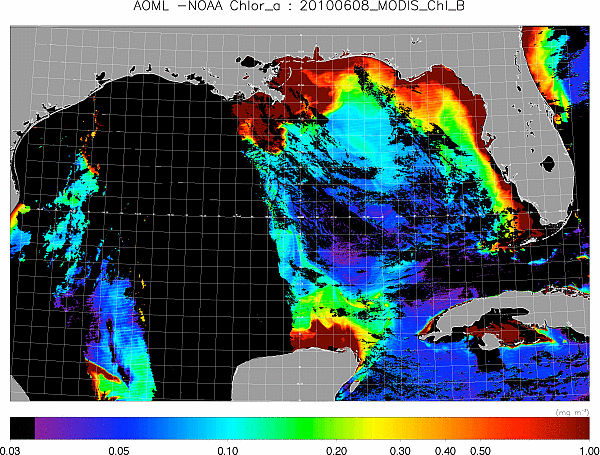
The map below shows the ocean color (chlorophyll-a) fields in the Gulf of Mexico using MODIS/Aqua data from CoastWatch Caribbean Regional Node. This 36-band satellite sensor is a primary source of ocean color data since its launch in May 4th, 2002. Gray areas indicate regions covered by clouds obscuring the view of the ocean surface from the satellite sensors.

Sea surface color in the Gulf of Mexico

For color fields on previous dates:

To see an animation of the color field, please select one of the month below:

Data source: NOAA CoastWatch

The map below shows the ocean color (chlorophyll-a) fields in the Gulf of Mexico using 3-day composites of MODIS/Aqua data from CoastWatch Caribbean Regional Node. These composites images allow to observe the ocean color field in the region with a better coverage than the one provided by the daily fields above.

Sea surface color 3-day composites in the Gulf of Mexico
Color Scale - Chlorophyll-a (mg m^-3)

For color fields on previous dates:

To see an animation of the color field, please select one of the month below:


Data source: NOAA CoastWatch

The map below shows the color (chlorophyll-a) field in the Gulf of Mexico.

Sea surface color in the Gulf of Mexico

For color fields on previous dates:

To download a high resolution version of this product, please select one of the dates below:

May 23, 2010 June 1, 2010
May 24, 2010 June 8, 2010
May 25, 2010

Data source: NASA Goddard Space Flight Center (GSFC)