Brazil-Malvinas Confluence Region
Wavelet Analysis
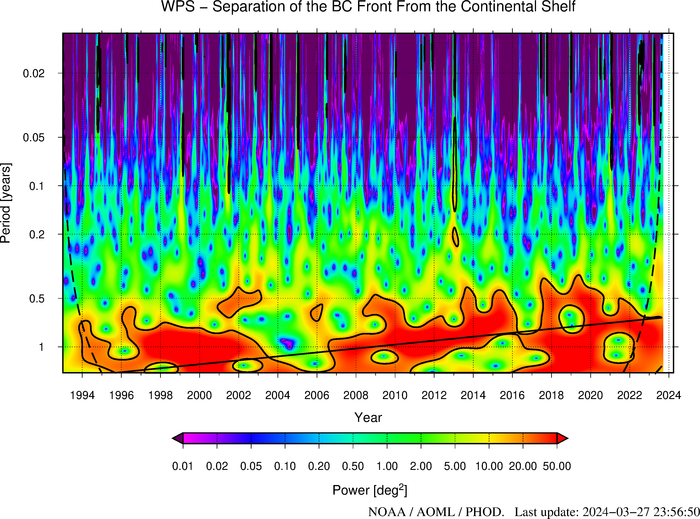
Wavelet Analysis of the Separation of the Brazil Current (BC) Front From the Continental Shelf
The figure below shows the Wavelet Power Spectrum (WPS) of the latitude of separation of the BC front from the continental shelf, defined as the intersection between the -1000m bathymetry contour and the contour when the 10°C isotherm is 200m deep. The solid black contour represent the peak-based significance levels, computed at 95%. The dashed curve indicates the cone of influence (COI). Edge effects become important in regions of the wavelet spectrum below the COI.
This figure is updated monthly using delayed-time data (about 6 month delay) and near real-time altimetry data (4 week delay) when delayed-time data are not available.
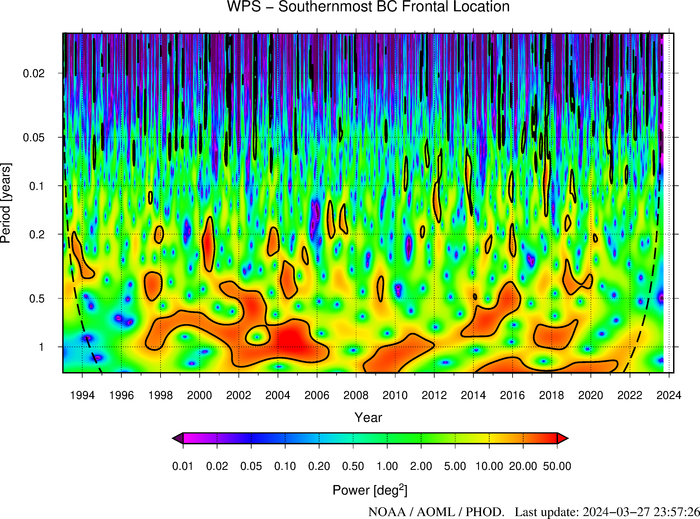
Wavelet Analysis of the Southernmost Frontal Location
The figure below shows the WPS of the latitude of the southernmost frontal location defined as the southernmost position of the altimeter derived 200m contour of the 10°C isotherm. The solid black contour represent the peak-based significance levels, computed at 95%. The dashed curve indicates the COI. Edge effects become important in regions of the wavelet spectrum below the COI.
This figure is updated monthly using delayed-time data (about 6 month delay) and near real-time altimetry data (4 week delay) when delayed-time data are not available.
Please refer to this link for data, products and results aknowledgement and distribution.