Atlantic Warm Pool
TCHP Area Index Time Series
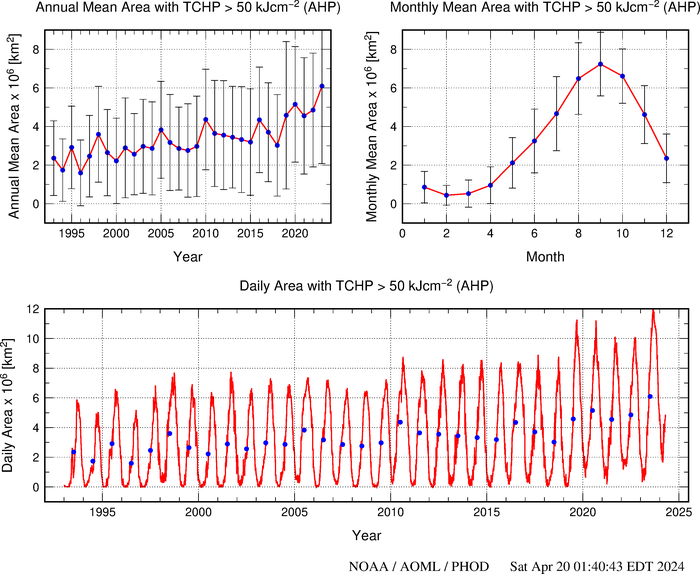
The figures at the top show the annual and monthly heat pool area index, defined as the area inside the 50 kJcm-2 Tropical Cyclone Heat Potential (TCHP) contour, in the Atlantic Heat Pool (AHP) region. The lower plot is the area index time series in the region from January 1993 to the present, with one observation every approximately two days.
These figures are updated once a month to include the most recent data. The vertical bars are one standard deviation.
Please refer to this link for data, products and results acknowledgment and distribution.