Hourly Drifter Data


Hourly location, current velocity, and temperature estimated from Global Drifter Program drifters world-wide


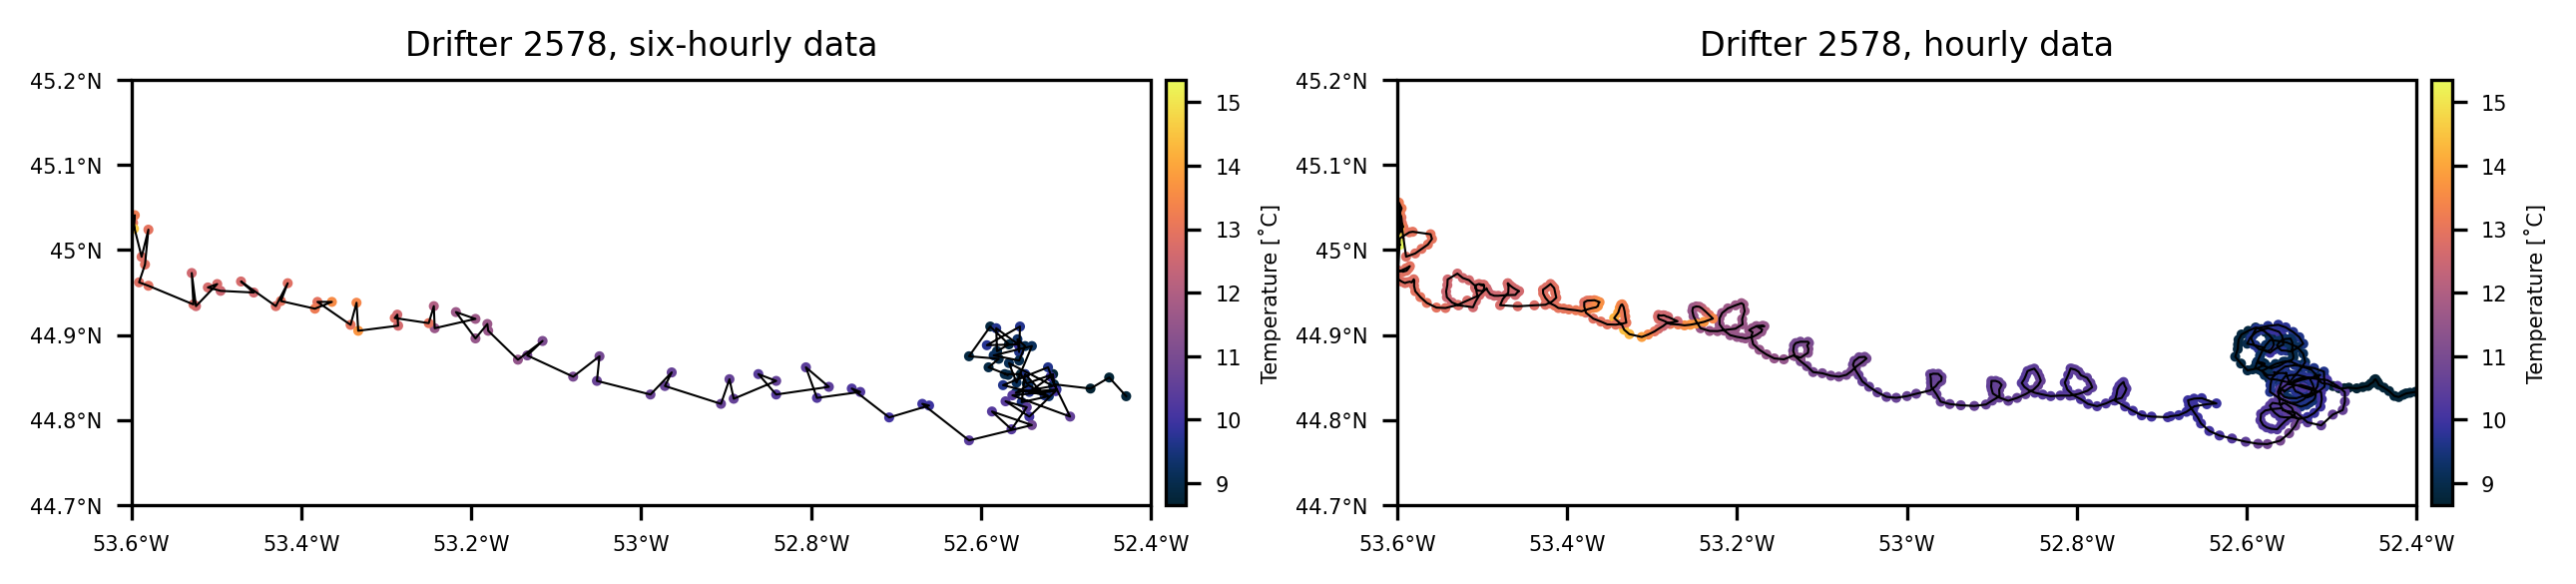
Figure caption:Position and SST comparison between the GDP 6-hourly and hourly products for a single drifter. The python code to produce this figure is freely available on a github repository as part of the Clouddrift project.


This dataset includes hourly sea surface temperature and current estimates using data collected by satellite-tracked surface drifting buoys ("drifters") of the NOAA Global Drifter Program. The Drifter Data Assembly Center (DAC) at NOAA’s Atlantic Oceanographic and Meteorological Laboratory (AOML) has applied quality control procedures and processing to edit these observational data and obtain estimates at regular hourly intervals. The data include positions (latitude and longitude), sea surface temperatures (total, diurnal, and non-diurnal components) and velocities (eastward, northward) with accompanying uncertainty estimates. Metadata include identification numbers, experiment number, start location and time, end location and time, drogue loss date, death code, manufacturer, and drifter type.


Two papers describe how these dataset were derived:


Elipot et al. 2016 (for position and velocity) and


Elipot et al. 2022 (for sea surface temperature).


Please see below for release notes, how to access data, and how to cite this dataset.

Data Access


Hourly Data via GDP ERDDAP


Hourly Data via NOAA NCEI

  • The hourly dataset is officially available from NOAA NCEI at https://doi.org/10.25921/x46c-3620. After accessing this page, click on the “Lineage” tab and on the link for “Output Datasets”, then “data”, then “0-data”, to download through your web browser. Alternatively, click on this link to download the NetCDF file directly (size is about 16GB for the latest release).
  • The dataset is distributed as a single NetCDF file containing contiguous ragged arrays, one for each data variable, as well as all metadata.


Hourly Data via Amazon Web Services (AWS)

  • In partnership with Dr. Shane Elipot (Univ. of Miami) and NOAA’s Open Data Dissemination Project, the hourly drifter dataset is available on the Registry of Open Data on the AWS cloud as a S3 bucket.
  • After accessing this page, on the right side, under "Explore", click on the "Browse Bucket" link. The dataset can be downloaded from this bucket in various format (NetCDF, zarr, parquet, etc.) but it can also be opened "lazily" without downloading the data for cloud access and computing. An example of how to do this with python and xarray is provided in this Jupyter notebook on Github.


Alternative ways of accessing earlier dataset version/releases:


Data Resource:

Citations

When using this dataset in your studies or publications, please use the following citation:


Elipot, Shane; Sykulski, Adam; Lumpkin, Rick; Centurioni, Luca; Pazos, Mayra (2022). Hourly location, current velocity, and temperature collected from Global Drifter Program drifters world-wide.[indicate subset used]. NOAA National Centers for Environmental Information. Dataset. https://doi.org/10.25921/x46c-3620. Accessed [date].


Additionally, we would be very grateful if you could cite the papers describing how the dataset were derived. If you use the dataset of position and velocity, please cite:


Elipot, S., R. Lumpkin, R. C. Perez, J. M. Lilly, J. J. Early, and A. M. Sykulski (2016), A global surface drifter dataset at hourly resolution, J. Geophys. Res. Oceans, 121, doi:10.1002/2016JC011716.


And if you use the dataset of sea surface temperature, please cite:


Elipot, S., A. Sykulski, R. Lumpkin, L. Centurioni, and M. Pazos (2022), A Dataset of Hourly Sea Surface Temperature From Drifting Buoys, Scientific Data, 9, 567, doi:10.1038/s41597-022-01670-2.

Release Notes


Release notes for version 2.01, September 2023:

  • Adds new position, velocity, and SST-related variable estimates to previous version 2.00.
  • This version adds data from drifters that were still alive at the cut-off date of v2.00 (30-Jun-2020 23:00:00) and data from recently released individual drifters that generated data after that date. This version now includes 197,214,787 estimates of position and velocity derived following the method described in Elipot et al. 2016 and SST (and related variables) from the methods described in Elipot et al. 2022. The new dataset spans 03-Oct-1987 13:00:00 to October 31 2022 23:00:00.
  • Please note that because of the methods employed to process the data of each drifter trajectory, the variable estimates in v2.01 for the living drifters at the previous cut-off date will differ slightly from the estimates in v2.00.
  • Some new variables have been added: start_date, start_lon, and start_lat that indicate the date and time and longitude and latitude of the first good observational data point as determined by the quality-control procedure of the GDP DAC at AOML. Note that these data differ from the deploy_date, deploy_lon, and deploy_lat data that correspond to the coordinates recorded at sea by the operator who deployed the drifter. In addition, the start_* variables do not necessarily correspond to the first estimated hourly data point for each drifter.
  • An issue with the flagging of SST estimates was discovered in v2.00 and is now fixed in v2.01. As explained in Elipot et al. 2022, a quality flag 1 indicates that the estimation of the SST uncertainty variables has failed and therefore that the uncertainty variables (err_sst, err_sst1, err_sst2) should exhibit a _FillValue. Yet, in version 2.00, less than 0.18% of the SST estimates with quality flag 1 did exhibit finite uncertainty estimates and therefore were flagged incorrectly. Version 2.01 corrects this flagging error. The careful reader of Elipot et al. (2022) might ignore the part of the caption of Figure 7 where it is written that “The two populations […] are flagged with quality flag 1”. That is incorrect: these two populations can have any of the flags 3, 4, and 5.
  • In Elipot et al. 2022, the flagging scheme for diurnal SST is based on the fulfillment of three criteria, denoted (1), (2), and (3). As written in the paper, a quality flag 2 should indicate that “none [of these criteria] are fulfilled”. This is incorrect and a quality flag 2 actually indicates that “the three criteria are not all fulfilled”. It other words, quality flag 5 indicates that criteria (1), (2), and (3) are fulfilled, quality flag 4 indicates that criteria (1) and (2) are fulfilled but not (3), quality flag 3 indicates that criteria (1) is fulfilled but neither are (2) and (3), and quality flag 2 indicates all other five combinations of fulfillment of the three criteria, including that none are fulfilled.

Release notes for earlier versions can be found here.