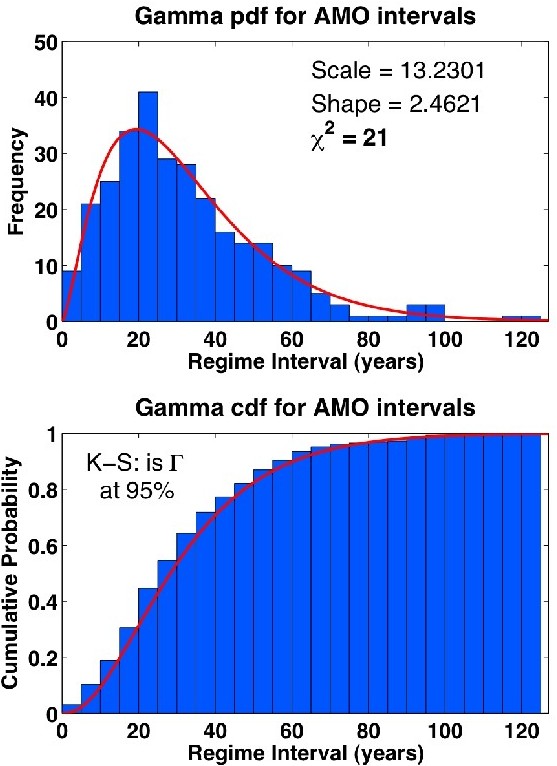
 Fig. 3 Upper panel: histogram (vertical bars) of zero
crossing intervals from a set of five resampled and smoothed versions of the Gray
et al. [17] index and the maximum likelihood (MLE) gamma probability distribution
(solid curve) fit to the histogram. Lower panel: cumulative empirical distribution
(vertical bars) and gamma cumulative distribution function (solid curve),
indicating that the Kolmogorov-Smirnov goodness-of-fit criterion is satisfied at
the 95% significance level.
Fig. 3 Upper panel: histogram (vertical bars) of zero
crossing intervals from a set of five resampled and smoothed versions of the Gray
et al. [17] index and the maximum likelihood (MLE) gamma probability distribution
(solid curve) fit to the histogram. Lower panel: cumulative empirical distribution
(vertical bars) and gamma cumulative distribution function (solid curve),
indicating that the Kolmogorov-Smirnov goodness-of-fit criterion is satisfied at
the 95% significance level.


Projecting the Risk of Future Climate Regime Shifts
Figure 3
| Climate Regime Shift |
| Objective |
| Rationale |
| Research Phase |
| Development phase |
| Example Applications |
| Accomplishments |
| Project Resources |
| References |
| D2M risk article |
| Q-&-A about the AMO |
| Contacts |
| Project participants |