Gridded and Mapped Data Caribbean 2002-2019
Rik Wanninkhof
|
The data products listed below are obtained from observations on the Royal Caribbean Cruise Lines (RCCL) ships Explorer of the Seas (EoS) (2002-2015); the Allure of the Seas (AoS) (2016-ongoing) and the Celebrity Equinox (Eqnx) (2015-ongoing) covering the years 2002 through 2019. The cruise tracks are shown in the figure below. The reduced and quality controlled data and metadatacan be obtained from: https://www.aoml.noaa.gov/ocd/ocdweb/occ.html and collated in an annual folder at https://www.nodc.noaa.gov/ocads/oceans/VOS_Program/explorer.html. The data products linked below are fully described in the ESSD paper by Wanninkhof et al. (2020). Four different products are provided in Excel spreadsheets that contain sea surface temperature (SST), salinity (SSS), mixed layer depth, fugacity of CO2 in seawater (fCO2w), Alkalinity (TA), pH, Aragonite saturation state (WAr), and air-sea CO2 flux (CO2_Flux). The gridded data , on a monthly 1 degree by 1 degree grid, cover the cruise tracks while the mapped data are gap filled using multi-linear regression technique (MLR) for fCO2w for the region spanning 15° N to 28° N and 62° W to 88° W.
Annual multi-linear regression (MLR) coefficients for the equation: fCO2w_MLR = a Longitude + b Latitude + c SST + d MLD + e SSS + f. The MLR from 2002 – 2018 are unchanged from Table 1 in Wanninkhof et al. 2020. The coefficients and their uncertainty (1-sigma) for 2019 are added to this file. Wanninkhof, R., Pierrot, D., Sullivan, K., Barbero, L., & Triñanes, J. (2020). A 17-year dataset of surface water fugacity of CO2 along with calculated pH, aragonite saturation state and air–sea CO2 fluxes in the northern Caribbean Sea. Earth Syst. Sci. Data, 12(3), 1489-1509. (Link to Paper) 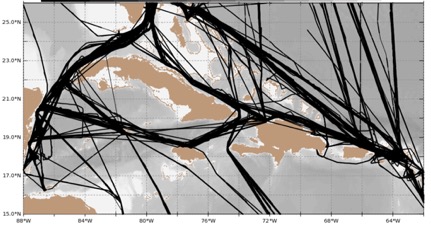
|