About the Flora
In 2000, Royal Caribbean International started a collaboration with the University of Miami's Rosenstiel School of Marine and Atmospheric Science (RSMAS), the National Oceanic and Atmospheric Administration (NOAA), the National Science Foundation (NSF), the Office of Naval Research (ONR), and the National Aeronautics and Space Administration (NASA) to have one of its ships, the Explorer of the Seas, equipped with a whole array of scientific instruments geared toward monitoring the atmosphere and the ocean.
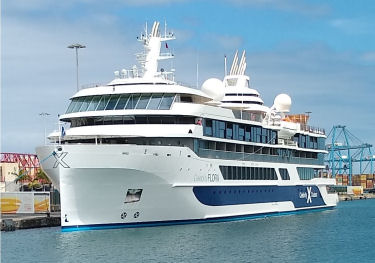
In February of 2019, our group installed an autonomous instrument on the Celebrity Flora to measure CO2 in the surface water, primarily in the Caribbean region. Since then, CO2 instruments were installed on two additional cruise ships: Equinox and Allure of the Seas. In 2019, a CO2 instrument was installed aboard the new Celebrity Cruise ship, Flora, specifically designed for tours in the Galapagos Islands. The installation was completed during the Flora's inaugural cruise across the Atlantic in June. Repeating loops around and through the Galapagos Islands started in July, 2019.
The installations continue a partnership with RSMAS, who not only provides the seawater supply infrastructure to which our systems are connected but also the computer network to allow constant access to the system computers and data. The pCO2 instrument on the Allure of the Seas takes 100 water measurements about every 4 hours. Data files are transferred to AOML every day so that the system operation can be monitored. The final data are processed after a cruise is completed and then posted to international databases and to this web site.
About this Website
This web site provides access to the fugacity of CO2 (fCO2) data collected on this ship.
Note, fCO2 is the partial pressure pCO2 corrected for non-ideality of the CO2
gas; they are numerically similar (fCO2 ≃ 0.995 pCO2). The processed data are organized by
year and by cruise. For each cruise, the color coded fCO2 values are plotted along the ship's cruise
track on a chart. Next to each chart are links to the comma-delimited data file and the associated Readme
file. To download a data file, select the year from the drop-down list box and click on GO. Choose a chart and
cruise, right-click on the link to its data file or Readme file, and select the download option. Please consult
with and acknowledge the AOML Ocean Carbon Cycle group if data is used for publication or presentation (contacts
in Master Readme, or Denis.Pierrot@noaa.gov).
The Master Readme link in the menu bar on the left provides meta data that is applicable for all data gathered from this ship. The individual Readme files next to the charts provide meta data specific to the associated cruise. The Realtime Display link displays plots of the raw xCO2 data as a function of time and location. These plots are suitable for monitoring but are not suitable for environmental interpretation since the Realtime data has not been processed nor quality controlled.